


In the modern business landscape, understanding how a client interacts with your brand is no longer optional. It is the foundation of retention and growth. A customer journey map visualizes the entire experience a person has with your organization. It moves beyond simple transaction data to capture the emotional and psychological shifts that occur during every interaction.
Creating a map requires breaking down complex behaviors into manageable sections. Without a structured approach, data becomes noise. By focusing on the core elements, teams can align their strategies and identify friction points before they cause churn. This guide details the five fundamental pillars required to build a map that offers genuine insight.
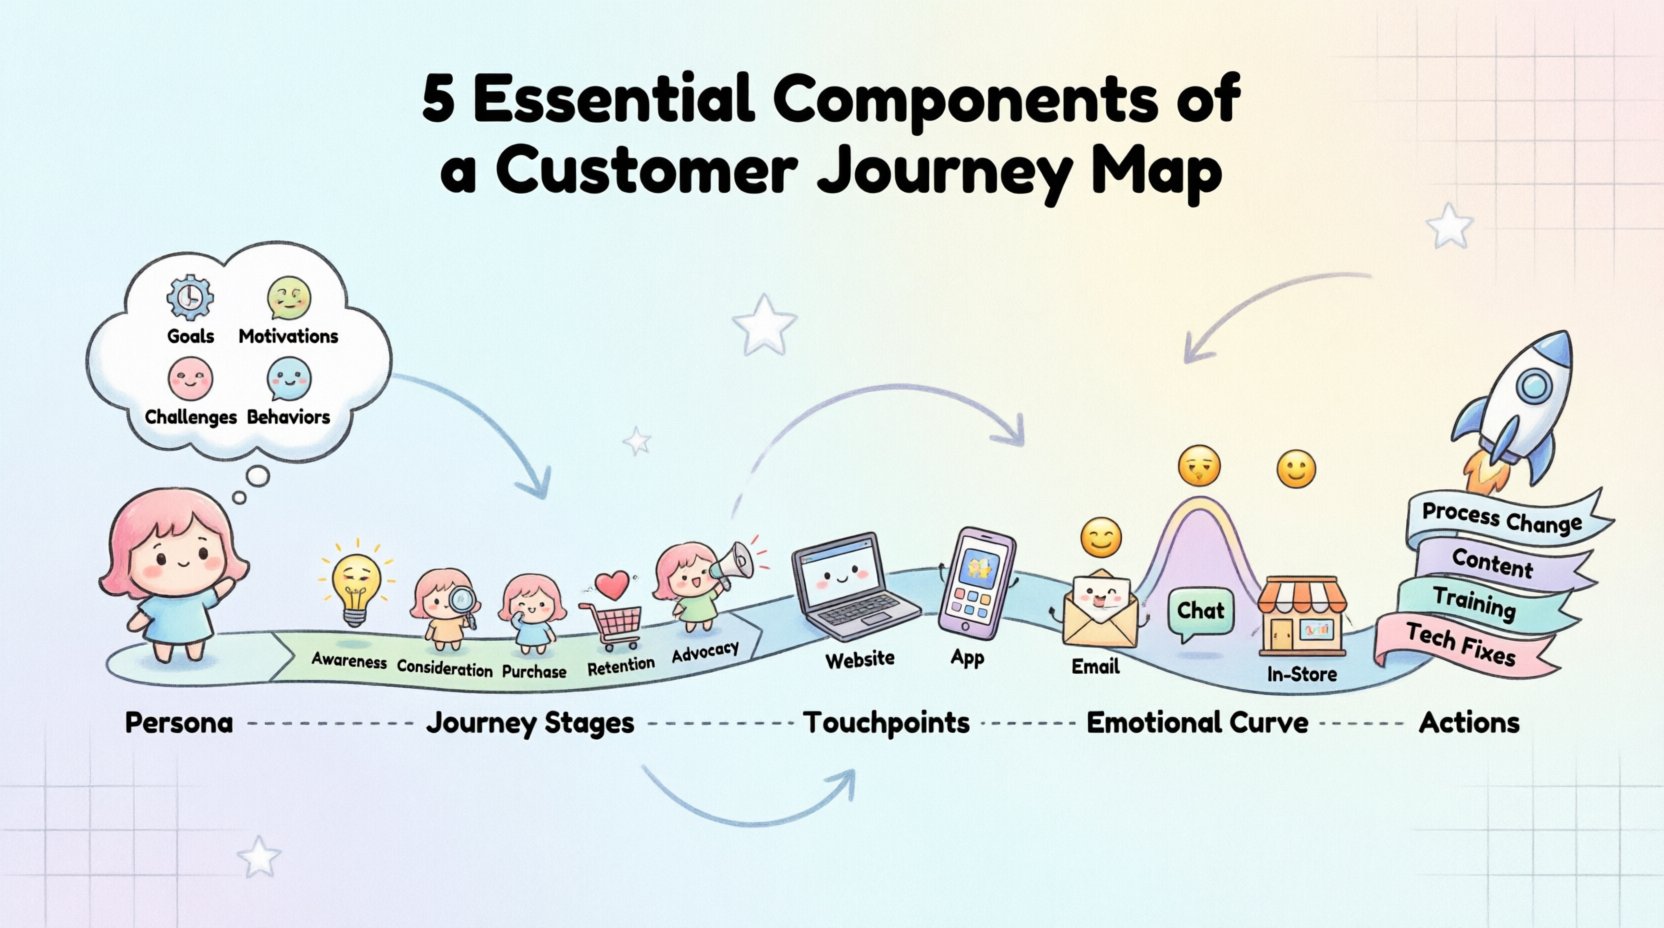
1. The Customer Persona 👤
The journey does not exist in a vacuum; it belongs to a specific person. A generic map often fails because it attempts to serve everyone. A persona represents a semi-fictional character based on real data and research. This component defines who is walking the path.
When defining this component, avoid relying solely on demographics like age or location. While useful, these do not explain motivation. Instead, focus on:
- Goals: What specific problem is this person trying to solve?
- Motivations: What drives them to take action? Is it cost, convenience, or status?
- Challenges: What barriers do they face in their daily life or industry?
- Behavioral Patterns: How do they typically research or buy?
Consider a persona named “Sarah.” She is a small business owner looking for accounting software. She values speed over advanced features. If you map a journey for “Sarah,” the touchpoints will differ from a persona named “James,” who is a CFO focused on security and compliance. Mapping the wrong persona leads to wasted resources and irrelevant marketing.
Ensure your persona is backed by qualitative data. Interviews, surveys, and support ticket analysis provide the narrative needed to flesh out the human element. Without this anchor, the rest of the map lacks context.
2. The Journey Stages 🔄
Once the person is defined, the timeline must be established. Stages represent the phases of the relationship between the customer and the brand. This component answers when the interaction happens. It provides the horizontal axis for your visual representation.
While every industry differs, most journeys follow a logical progression. Common stages include:
- Awareness: The customer realizes they have a need and begins searching for solutions.
- Consideration: The customer evaluates options and compares providers.
- Purchase: The decision is made, and the transaction occurs.
- Retention: The customer uses the product or service post-purchase.
- Advocacy: The customer recommends the brand to others.
It is crucial to map the entire lifecycle, not just the sales period. Many organizations stop mapping at the purchase point. However, the retention phase often holds the highest value. A customer who struggles after buying is more likely to leave than a customer who was hard to convert initially.
Be careful not to make the stages too granular. If you have twenty stages, the map becomes unreadable. Aim for 5 to 7 distinct phases that cover the macro experience. This keeps the team focused on high-level trends rather than getting lost in micro-details.
3. Touchpoints 📱
A touchpoint is any point of contact between the customer and the brand. This component answers where the interaction occurs. A customer journey map is essentially a collection of these touchpoints arranged chronologically.
Touchpoints can be digital, physical, or human. They include:
- Website Pages: Landing pages, product descriptions, blog posts.
- Social Media: Comments, direct messages, shares, ads.
- Email: Newsletters, transactional emails, automated sequences.
- Customer Support: Chatbots, phone calls, help desk tickets.
- Physical Locations: Retail stores, offices, packaging.
Consistency is key here. A customer should feel the brand identity remains stable across all channels. If the tone of voice on social media is casual, but the support email is overly formal, the experience feels disjointed. This component requires a holistic view of the organization.
Use the following table to categorize your touchpoints for better clarity:
| Touchpoint Type | Example | Owned or Earned? |
|---|---|---|
| Website | Product Page | Owned |
| Advertising | Search Ad | Paid |
| Referral | Friend Recommendation | Earned |
| Support | Live Chat | Owned |
Mapping these correctly ensures you know which channels are driving value and which are causing friction. You may find that a specific social media channel brings in traffic, but the website fails to convert it. That is a critical insight for optimization.
4. Emotions and Pain Points 😓
Data tells you what happened; emotions tell you why it mattered. This component captures the internal state of the customer. It answers how the customer feels at each stage. This is often the most overlooked aspect of mapping.
A customer might complete a purchase (data), but they might feel anxious about the delivery time (emotion). If you ignore this, you miss the opportunity to alleviate that anxiety. Common emotional states to track include:
- Frustration: Confusing navigation, slow loading times, unhelpful staff.
- Confusion: Unclear pricing, complex terms, lack of information.
- Excitement: Discovering a new feature, receiving a gift.
- Satisfaction: Smooth checkout, timely delivery, resolving an issue.
- Apathy: Lack of engagement, ignoring communications.
To map this effectively, plot an emotional curve. High points represent moments of delight. Low points represent moments of pain. The goal is to flatten the lows and raise the highs. For example, if a customer feels frustrated during the checkout process, that is a critical pain point to address immediately.
Identifying these moments requires listening. Customer feedback forms, social sentiment analysis, and direct interviews provide the raw material for this section. Do not assume you know how they feel; verify it with evidence.
5. Opportunities and Actions 🚀
The final component transforms the map from a passive document into an active strategy. This section answers what the organization should do next. It bridges the gap between insight and execution.
Once you have identified pain points and emotional dips, you must assign ownership. Who is responsible for fixing this? What is the specific action required? This turns the map into a roadmap for improvement.
Examples of actions include:
- Process Change: Reducing the number of clicks required to complete a task.
- Content Creation: Writing a guide to clarify a confusing policy.
- Training: Teaching support staff how to handle specific objections.
- Technical Fixes: Improving page load speed or mobile responsiveness.
Without this component, the map is merely a history book. With it, the map becomes a plan for the future. Prioritize opportunities based on impact and feasibility. You cannot fix everything at once, so focus on the changes that will yield the highest return on investment.
Why These Components Matter Together 🤝
Each of these five components relies on the others. A persona without stages is just a profile. Stages without touchpoints lack context. Touchpoints without emotion lack depth. Emotion without action leads to stagnation. Together, they create a complete picture of the customer experience.
When implemented correctly, this framework helps departments align. Marketing knows what the customer is feeling during the awareness stage. Product knows what features are needed during consideration. Support knows what anxieties arise during retention. Silos break down when everyone sees the same map.
Common Pitfalls to Avoid ⚠️
Even with a solid framework, mistakes happen. Awareness of common errors can save time and resources.
- Assuming One Map Fits All: Do not try to map every customer with a single document. Segment your audience. A B2B enterprise client has a different journey than a B2C individual.
- Ignoring the Backstage: Customer journeys are supported by internal processes. If your internal systems are slow, the customer experience suffers. Map the backend support required for the frontend experience.
- Static Mapping: Customer behaviors change. A map created today may be obsolete in a year. Treat the document as living and update it regularly.
- Focusing on the Brand, Not the Customer: Ensure the language used reflects the customer’s voice, not corporate jargon. Use “I” and “You” instead of “We” and “The Company”.
Implementing the Map in Your Workflow 🛠️
Once the five components are defined, the work moves to integration. How do you ensure this map influences daily decisions?
- Workshops: Gather cross-functional teams to review the map. Discussing it together ensures shared understanding.
- Metrics: Link specific map sections to key performance indicators. If the “Consideration” stage is weak, track conversion rates.
- Testing: Use the map to design A/B tests. If you suspect a specific touchpoint causes confusion, test a new version of it.
- Communication: Share the map with new hires. It serves as an excellent onboarding tool for customer-facing roles.
Remember that the goal is empathy. The map is a tool to help you stand in the customer’s shoes. When you make decisions based on this empathy, the relationship strengthens. Trust builds, and loyalty follows.
Data Sources for Accurate Mapping 📊
Accuracy is paramount. Guessing leads to misalignment. Rely on a mix of quantitative and qualitative data to populate your five components.
- Web Analytics: Provides data on traffic, bounce rates, and navigation paths.
- CRM Records: Shows historical interactions and purchase history.
- Support Logs: Reveals recurring issues and sentiment.
- Social Listening: Captures unfiltered opinions and public sentiment.
- User Testing: Observes real-time behavior and reactions.
Triangulating these sources creates a robust foundation. If analytics say users drop off at a certain point, but interviews say they don’t notice, you have a discrepancy to investigate. This depth of understanding is what separates good strategies from great ones.
Measuring Success Over Time 📈
After implementing changes based on your map, you must measure the outcome. Did the emotional dip resolve? Did the conversion rate improve? Did support tickets decrease? Establish a baseline before making changes.
Track metrics such as:
- Customer Satisfaction Score (CSAT): Direct feedback on specific interactions.
- Net Promoter Score (NPS): Likelihood of recommendation.
- Customer Effort Score (CES): How easy it was to complete a task.
- Retention Rate: Percentage of customers who return.
Review these metrics quarterly. The map is not a one-time project; it is a continuous cycle of improvement. As your business evolves, so does the customer journey. Keep the map current to maintain its relevance.
Final Thoughts on Experience Design 🌟
Building a customer journey map is an investment in understanding. It requires time, honesty, and a willingness to challenge internal assumptions. By focusing on the five essential components—persona, stages, touchpoints, emotions, and actions—you create a blueprint for superior service.
The result is not just a document, but a shift in culture. Teams begin to prioritize the human behind the transaction. They stop asking “what can we sell?” and start asking “what does the user need?”. This shift is where sustainable growth is found.
Start small. Pick one journey. Map one persona. Identify the friction. Fix the friction. Repeat. The path to a better experience is paved with these small, deliberate steps.
Your customers are waiting for a better experience. Give it to them with clarity and purpose.

