


Strategic planning requires a clear understanding of the external environment. A PEST analysis provides a structured framework to evaluate Political, Economic, Social, and Technological factors. Many organizations struggle with this process, often resulting in vague insights that do not drive actionable decisions. This guide outlines a rigorous approach to conducting a precise PEST analysis, ensuring your strategic decisions are grounded in reality rather than speculation.
The goal is not merely to list factors but to understand their impact on your specific business context. By following established best practices, you can eliminate guesswork and create a reliable foundation for growth. This comprehensive approach covers the essential components, data collection methods, and integration strategies needed for success.
🔍 Understanding the Four Pillars of PEST Analysis
Before diving into the methodology, it is crucial to understand what each component represents. A robust analysis treats these four categories as dynamic forces rather than static lists.
🏛️ Political Factors
- Government stability and policy changes
- Tax policies and trade restrictions
- Employment laws and regulations
- Environmental regulations and compliance
💰 Economic Factors
- Gross Domestic Product (GDP) growth rates
- Interest rates and inflation levels
- Exchange rates and currency stability
- Disposable income and consumer spending patterns
👥 Social Factors
- Demographic shifts and population growth
- Cultural norms and lifestyle trends
- Education levels and workforce availability
- Health consciousness and ethical standards
⚙️ Technological Factors
- Emerging technologies and innovation rates
- Research and development activity
- Automation and digital transformation trends
- Technology infrastructure and accessibility
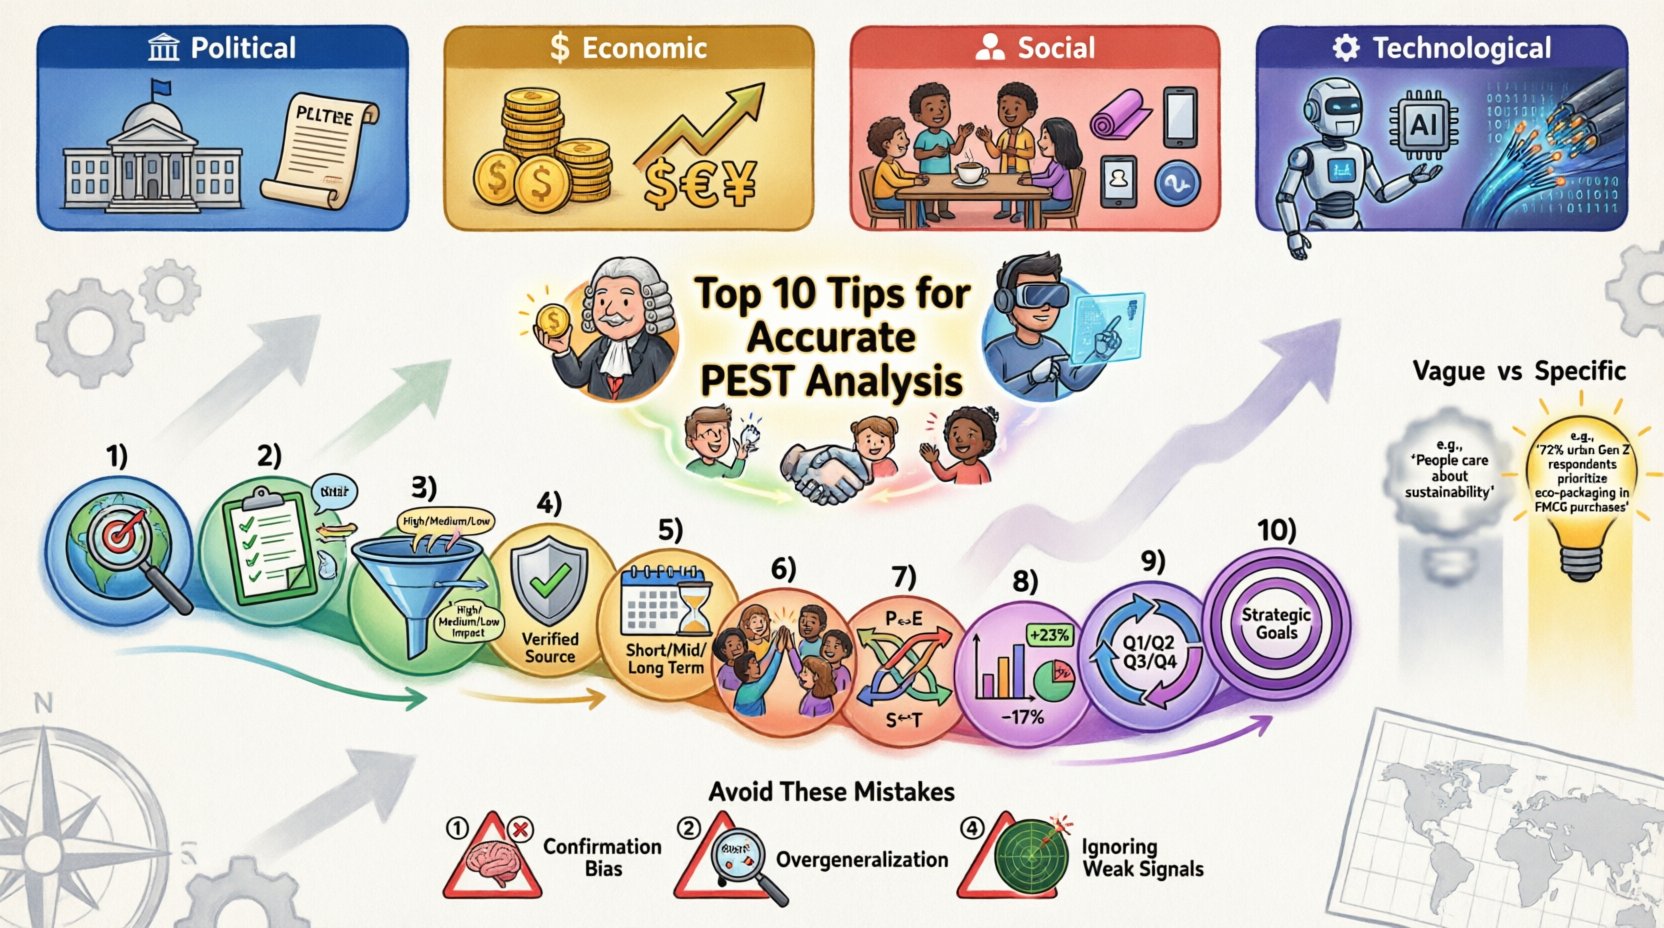
🛠️ The 10 Best Practices for Accuracy
Achieving precision in your analysis requires discipline. The following steps provide a roadmap for gathering high-quality information and interpreting it correctly.
1. Define Scope Clearly 🎯
Every analysis has boundaries. Without a defined scope, the data becomes overwhelming and unfocused. Determine the geographic region, the specific industry segment, and the time horizon you are analyzing. A global tech company requires a different scope than a local retail chain. Be explicit about what is included and excluded to prevent scope creep during the research phase.
2. Gather Primary and Secondary Data 📝
Reliance on a single source of information introduces bias. Combine secondary data, such as government reports and industry publications, with primary data from internal team insights. Secondary data offers breadth, while primary data provides depth regarding your specific operational context. Cross-referencing these sources validates your findings.
3. Focus on Relevance ⚖️
Not all factors are equally important. A change in tax law might be critical for a manufacturing firm but irrelevant for a software startup. Prioritize factors that directly influence your value proposition. Filter out noise by asking: “Does this factor change our business model or revenue stream?” If the answer is no, document it but do not prioritize it.
4. Validate Data Sources ✅
The credibility of your analysis depends on the credibility of your sources. Prefer peer-reviewed journals, official government statistics, and recognized market research firms. Avoid anecdotal evidence or unverified blog posts. Maintain a log of where each data point originated to ensure traceability and accountability during review.
5. Consider Time Horizons ⏳
External factors evolve at different speeds. Political shifts may happen overnight, while demographic changes take decades. Categorize factors by their immediacy. Short-term factors require immediate attention in operational planning, while long-term factors inform strategic direction. Distinguishing between temporary fluctuations and permanent trends is vital for accuracy.
6. Engage Cross-Functional Teams 👥
Insights from a single department create blind spots. Involve representatives from finance, marketing, operations, and human resources. Each team possesses unique knowledge about how external forces impact their specific functions. A collaborative approach ensures a holistic view of the environment and reduces the risk of oversight.
7. Identify Interdependencies 🔗
Factors rarely exist in isolation. A technological advancement might trigger a social shift, which subsequently influences economic policy. Map out the relationships between variables. For instance, a new regulation (Political) might increase costs (Economic), leading to higher prices for consumers (Social). Understanding these chains of causality adds depth to your analysis.
8. Quantify Where Possible 📊
Qualitative descriptions are useful, but quantitative data provides clarity. Instead of stating “inflation is rising,” specify “inflation is projected to rise by 2.5%.” Use statistical models where available to estimate the impact of external forces on your financial projections. Numbers allow for better comparison and risk assessment.
9. Review Regularly 🔄
A PEST analysis is not a one-time event. The external environment is dynamic. Schedule periodic reviews, such as quarterly or annually, to update findings. This ensures your strategy remains aligned with current realities. Outdated analysis can lead to missed opportunities or unanticipated risks.
10. Align with Strategic Goals 🎯
The final output must serve a purpose. Link your findings directly to your organization’s strategic objectives. If the goal is market expansion, focus on political stability and economic growth in target regions. If the goal is innovation, prioritize technological disruption. Ensure every factor analyzed ties back to a decision you need to make.
📋 Comparison: Vague vs. Specific Data
Accuracy often comes down to the specificity of your data. The table below illustrates the difference between a weak analysis and a strong one.
| Category | Vague Approach | Specific Approach |
|---|---|---|
| Political | Tax laws might change. | Proposed tax reform in Q3 could increase corporate tax by 2%. |
| Economic | Interest rates are high. | Central bank rates are at 5.25%, impacting loan costs by 15%. |
| Social | People are buying online more. | E-commerce adoption has grown 20% among 18-24 demographic. |
| Technological | New tech is emerging. | AI automation tools reduce manual entry time by 40%. |
🚫 Common Mistakes to Avoid
Even with a solid plan, pitfalls can derail the process. Awareness of common errors helps maintain integrity in your analysis.
- Confirmation Bias: Seeking only data that supports pre-existing beliefs. Actively look for evidence that contradicts your assumptions.
- Overgeneralization: Assuming trends apply universally. A trend in one region may not hold in another.
- Ignoring Weak Signals: Dismissing small changes that could lead to major shifts. Weak signals often precede major disruptions.
- Lack of Context: Analyzing data without understanding the historical or cultural background. Context explains the “why” behind the numbers.
- Static Thinking: Treating the analysis as a snapshot in time. The environment is fluid; your analysis must reflect movement.
🚀 Integrating Findings into Strategy
Gathering data is only half the battle. The true value lies in application. Once the analysis is complete, translate insights into actionable strategies.
Risk Mitigation
Identify high-impact risks from the Political and Economic sections. Develop contingency plans for scenarios such as regulatory changes or currency volatility. Assign owners to monitor these specific indicators.
Opportunity Identification
Look for gaps created by Social or Technological shifts. For example, a demographic shift might reveal an underserved market segment. Leverage technological advancements to improve efficiency or create new products.
Resource Allocation
Direct resources toward areas with the highest potential return based on the analysis. If a specific region shows favorable economic growth, consider allocating more capital there. Avoid spreading efforts too thinly across irrelevant factors.
📈 Maintaining the Analysis
Strategy is not static. To maintain accuracy, establish a routine for monitoring external factors. Create a dashboard of key indicators derived from your PEST analysis. This ensures that changes are detected early. Regularly schedule workshops to discuss the implications of new data.
Key Performance Indicators for Monitoring
- Regulatory filing dates
- Quarterly economic reports
- Consumer sentiment surveys
- Patent filings in your sector
By keeping these metrics visible, your team remains alert to changes. This proactive stance reduces the shock of unexpected market shifts.
🌐 The Role of Data Quality
The quality of your output is directly proportional to the quality of your input. Poor data leads to poor decisions. Invest time in verifying the source and date of information. Older data may no longer be relevant, especially in the Technological and Economic sectors where changes happen rapidly.
Ensure that your data collection methods are consistent. Changing methodologies mid-analysis can skew results and make comparisons invalid. Consistency allows for trend analysis over time.
🤝 Collaboration and Ownership
Assign ownership of each PEST category to a specific leader. This ensures accountability. The person responsible for the Economic section should have a deep understanding of financial markets. The leader for Social factors should understand consumer behavior. This specialization improves the depth of insight gathered.
Regular communication between these owners prevents silos. A change in the Economic section might impact the Social analysis. Cross-communication ensures the final document is cohesive.
📝 Documentation and Reporting
Document the process, not just the results. Record the assumptions made, the data sources used, and the reasoning behind the conclusions. This documentation is valuable for future reference and for auditing the strategic process. It allows new team members to understand the rationale behind decisions.
🔄 Continuous Improvement
After implementing strategies based on the analysis, review the outcomes. Did the factors you predicted actually happen? If not, analyze why. Was the data incorrect, or was the interpretation flawed? Use this feedback loop to refine your analysis process for the next cycle.
Improvement comes from reflection. Treat every analysis as a learning opportunity. Over time, your organization will develop a sharper intuition for external forces.
📌 Summary of Actionable Steps
To ensure you are ready to execute, keep this checklist handy.
- Define the geographic and industry scope 🌍
- Collect data from at least three distinct sources 📚
- Filter factors by direct business impact ⚖️
- Validate all data with official records ✅
- Categorize factors by short-term and long-term impact ⏳
- Involve stakeholders from all departments 👥
- Map relationships between different factors 🔗
- Use percentages and numbers instead of adjectives 📊
- Schedule quarterly review dates 🔄
- Link every finding to a strategic decision 🎯
Final Thoughts on Strategic Clarity
A well-conducted PEST analysis removes uncertainty from the decision-making process. It transforms external chaos into structured information that guides action. By adhering to these best practices, you ensure that your strategic planning is built on a solid foundation. The focus remains on accuracy, relevance, and continuous improvement. This disciplined approach separates successful organizations from those that struggle to adapt to changing market conditions.
Remember that the value lies in the insight, not the document itself. Use the analysis to spark discussion, challenge assumptions, and drive innovation. When executed correctly, this framework becomes an essential tool for navigating complex business landscapes.

