


Strategic planning requires more than just intuition; it demands a structured examination of the environment in which an organization operates. The PEST analysis stands as one of the most enduring frameworks for understanding external macro-environmental factors. Whether you are launching a startup, managing a corporate division, or revising a long-term roadmap, understanding the forces at play is critical.
This guide addresses 15 specific questions regarding PEST analysis. We will explore the mechanics, application, and nuances of the framework without the fluff. Our goal is clarity, precision, and actionable insight.
Foundations of the Framework 🏛️
1. What exactly is a PEST Analysis?
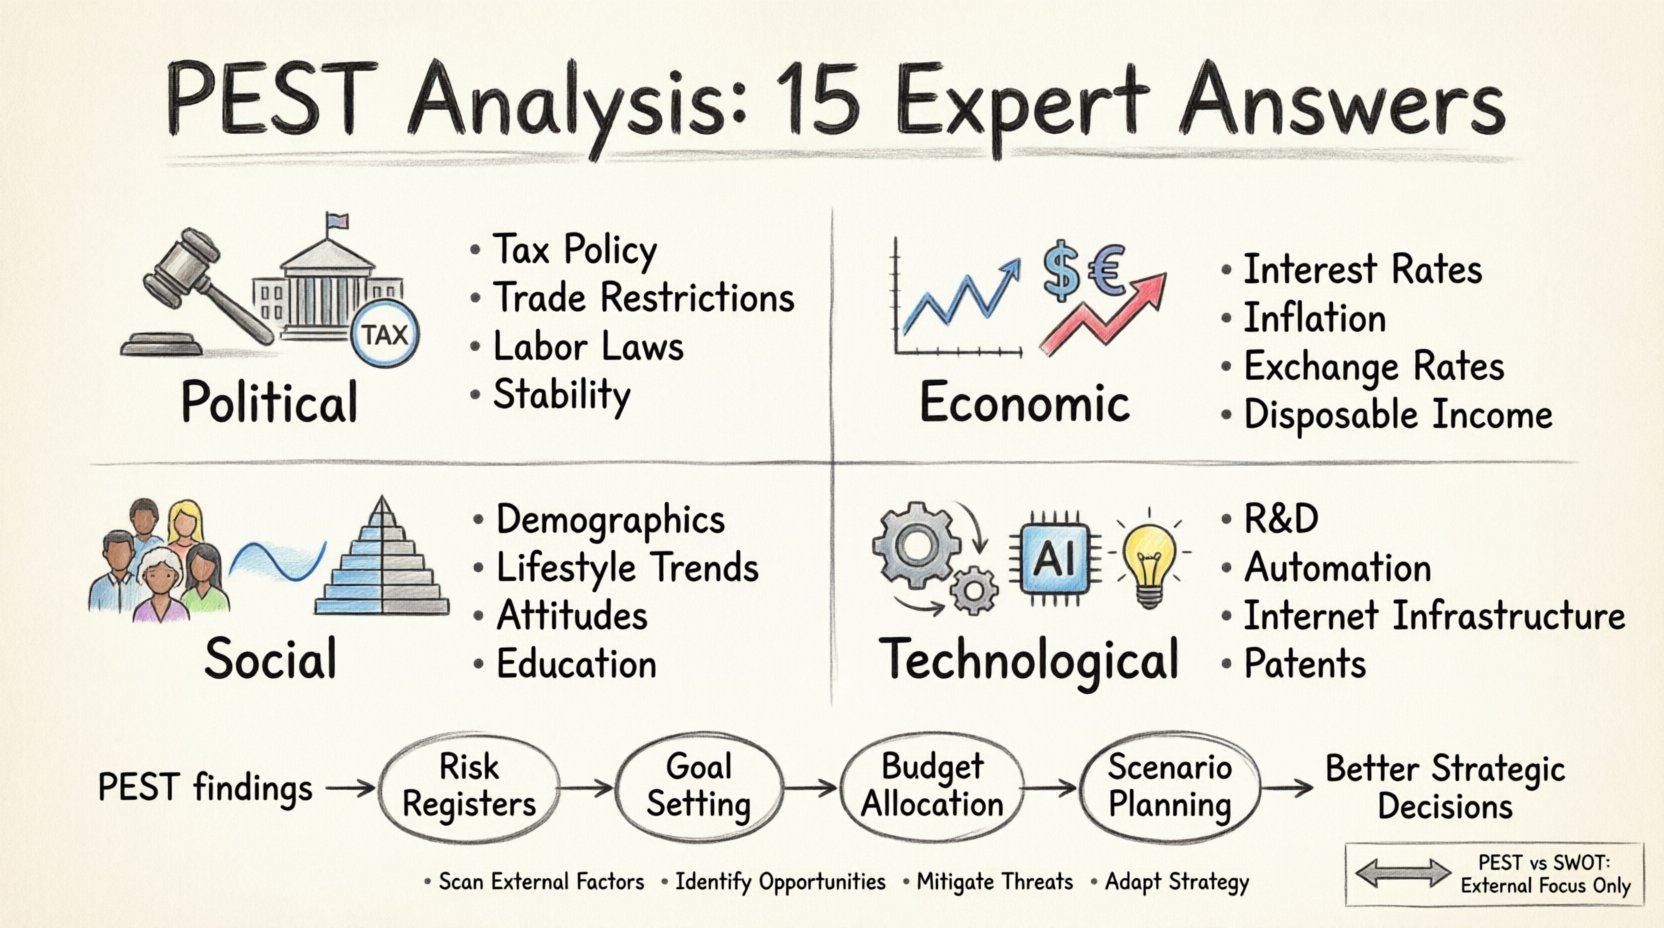
A PEST analysis is a strategic tool used to scan the external macro-environmental factors that can impact an organization. The acronym stands for:
- Political
- Economic
- Social
- Technological
It is not a tool for measuring internal strengths or weaknesses. Instead, it focuses on the uncontrollable external forces that create opportunities or threats. By categorizing these factors, teams can make informed decisions about risk mitigation and market entry.
2. Where did the PEST framework originate?
The roots of this methodology trace back to the 1960s and 1970s. The concept was popularized by Francis Aguilar, a Harvard Business Review author, who originally called it “Scanning the Business Environment.” Later, variants emerged, such as PESTLE and STEEPLE, to include Legal and Environmental factors. Despite the evolution, the core PEST structure remains the standard for high-level environmental scanning in business strategy.
3. How does PEST differ from SWOT analysis?
While both tools are staples of strategic planning, they serve different functions. A SWOT analysis (Strengths, Weaknesses, Opportunities, Threats) covers both internal and external factors. PEST focuses exclusively on the external environment.
In practice, the PEST analysis often feeds into the “Opportunities” and “Threats” sections of a SWOT matrix. Using them together provides a holistic view: PEST explains why the external landscape looks the way it does, while SWOT evaluates how your specific organization fits within that landscape.
Deep Dive into the Four Pillars 🔍
4. What falls under the Political category?
Political factors encompass government actions, policies, and stability that affect business operations. This is not limited to elections. Consider the following:
- Tax Policy: Changes in corporate tax rates directly impact net margins.
- Trade Restrictions: Tariffs, embargoes, or quotas can alter supply chain costs.
- Labor Laws: Regulations regarding minimum wage, unions, and working hours.
- Political Stability: The risk of civil unrest or regime change in operating regions.
For multinational corporations, political risk assessment is a continuous process, not a one-time event.
5. How do Economic factors influence strategy?
Economic conditions dictate the purchasing power of customers and the cost of capital. Key indicators include:
- Interest Rates: High rates increase borrowing costs, potentially slowing expansion.
- Inflation: Rising prices can erode profit margins if costs cannot be passed to consumers.
- Exchange Rates: Fluctuations affect import/export profitability for global firms.
- Disposable Income: The amount of money households have for spending after taxes and necessities.
Understanding the economic cycle (recession vs. expansion) allows businesses to adjust inventory levels and pricing strategies accordingly.
6. What are the key Social factors to monitor?
Social factors reflect the cultural and demographic aspects of the market. These are often slow-moving but have profound effects. Examples include:
- Demographics: Aging populations, birth rates, and migration patterns.
- Lifestyle Trends: Shifts toward remote work, health consciousness, or sustainability.
- Attitudes: Public sentiment regarding privacy, data usage, or corporate ethics.
- Education Levels: The skill availability in the workforce impacts hiring strategies.
Ignoring social shifts can lead to brand irrelevance. For instance, a failure to adapt to the demand for eco-friendly products can result in market share loss.
7. Why is Technological analysis critical?
Technological factors cover innovation, automation, and the rate of change. This is often the most volatile category. Consider:
- Research & Development: The level of innovation activity in your industry.
- Automation: Technologies that reduce labor costs or change production methods.
- Internet Infrastructure: Connectivity speeds and accessibility for digital services.
- Patent Laws: Intellectual property protections that safeguard innovation.
Disruptive technologies can render entire business models obsolete overnight. Continuous monitoring here is essential for survival.
Execution and Application 🚀
8. Should I use PEST or PESTLE?
PESTLE adds two dimensions: Legal and Environmental. For most general strategies, PEST is sufficient. However, industries heavily regulated by law (like healthcare or finance) or those with significant environmental footprints (like manufacturing or agriculture) require the PESTLE framework.
If your analysis misses legal compliance or climate change impacts, the strategy will be incomplete. Choose the model that fits the specific risk profile of your sector.
9. How often should a PEST analysis be conducted?
There is no fixed rule, but frequency depends on market volatility. In stable industries, an annual review may suffice. In fast-moving tech sectors or regions with political instability, quarterly reviews are advisable.
It is also wise to trigger a new analysis when a major event occurs, such as a new regulation, a pandemic, or a significant technological breakthrough. Treat it as a living document that evolves with the market.
10. What are the best sources for data collection?
Reliable data is the backbone of a valid analysis. Avoid relying on assumptions. Use:
- Government Reports: Census data, economic outlooks, and regulatory filings.
- Industry Publications: White papers, trade journals, and market research firms.
- News Outlets: Reputable business and political news sources.
- Internal Stakeholders: Sales teams and customer feedback can reveal shifting social trends.
Triangulating data from multiple sources reduces the risk of bias.
11. How do you distinguish between a trend and a fad?
This is a common challenge. Trends represent long-term shifts in behavior or values, while fads are short-term spikes. To differentiate, ask:
- Duration: Has this lasted more than 3-5 years?
- Impact: Does it affect multiple sectors or just one niche?
- Root Cause: Is it driven by demographic shifts (trend) or marketing hype (fad)?
Strategic planning should prioritize trends. Basing a five-year roadmap on a fad is a significant risk.
12. What are the common mistakes in PEST analysis?
Even experienced teams make errors. The most frequent pitfalls include:
- Too Much Detail: Listing hundreds of factors dilutes focus. Stick to the top 3-5 critical drivers per category.
- Internal Bias: Interpreting external factors through the lens of internal desires rather than reality.
- Static Thinking: Assuming current conditions will persist indefinitely.
- Isolation: Conducting the analysis in a vacuum without input from cross-functional teams.
Avoid these by keeping the scope focused and the data objective.
Integration and Strategy 📊
13. How do you integrate PEST findings into a business plan?
Analysis without action is merely observation. To integrate findings:
- Risk Registers: Convert identified threats into formal risk items with mitigation plans.
- Goal Setting: Align annual objectives with identified opportunities.
- Budget Allocation: Direct resources toward areas where external factors favor growth.
- Scenario Planning: Develop “what-if” scenarios based on different political or economic outcomes.
The output should directly influence resource allocation and strategic priorities.
14. Is this framework suitable for small businesses?
Yes, but with adjustments. Large corporations have dedicated teams for environmental scanning. Small businesses must be leaner.
- Focus: Concentrate on local regulations and immediate economic conditions.
- Speed: Keep the process agile. A simple one-page summary is often better than a 50-page report.
- Community: Leverage local networking to understand social and political shifts faster than large data sets.
The value lies in awareness, not the complexity of the document itself.
15. How do you measure the success of a PEST analysis?
Success is measured by the quality of decisions made afterward. Look for:
- Early Detection: Did you identify a threat before it impacted revenue?
- Opportunity Capture: Did you launch a product or service in time to benefit from a trend?
- Alignment: Did the strategy remain resilient when external shocks occurred?
If the analysis remains on a shelf gathering dust, it has failed. Its value is proven only through implementation.
Summary of Key Factors ⚖️
To assist in quick reference, here is a structured comparison of the primary components and their strategic implications.
| Factor | Key Question | Strategic Implication |
|---|---|---|
| Political | How does government policy affect us? | Compliance, Tax, Market Access |
| Economic | What is the financial climate? | Pricing, Costs, Investment |
| Social | What do people value and need? | Marketing, Product Fit, Hiring |
| Technological | How does tech change our industry? | Innovation, Efficiency, Disruption |
By systematically addressing these areas, organizations can navigate uncertainty with greater confidence. The external world will always change, but a structured approach ensures you are prepared to adapt.

