


Small and medium-sized enterprises (SMEs) operate in a landscape defined by volatility. Market shifts, regulatory changes, and technological advancements happen faster than ever before. For a business with limited resources, guessing the future is a luxury you cannot afford. You need structure. You need a method to translate raw external data into clear, actionable strategy. This is where the PEST analysis framework comes into play.
Many business owners treat strategic planning as a once-a-year exercise that gathers dust. However, a practical PEST analysis is a living document. It is a tool for scanning the horizon, identifying risks before they become crises, and spotting opportunities while competitors are still sleeping. This guide walks you through the process of conducting a PEST analysis specifically tailored for the constraints and needs of an SME, ensuring you move from passive observation to active implementation.
🧩 Understanding the Framework: What is PEST?
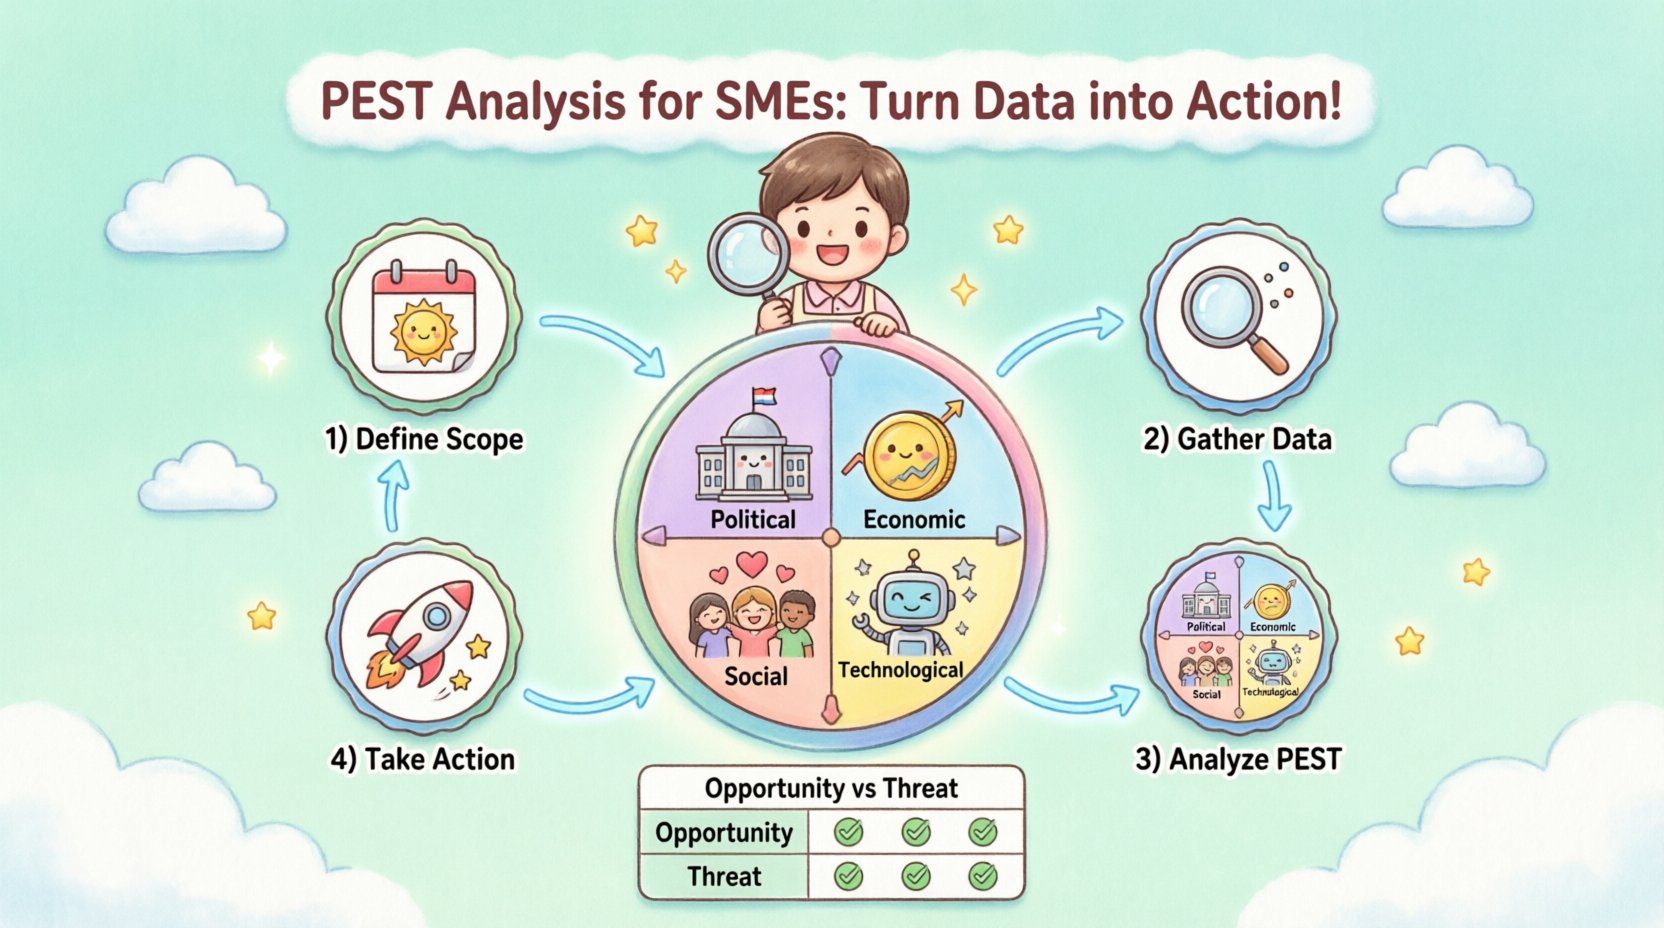
PEST stands for Political, Economic, Social, and Technological. It is a macro-environmental framework used to analyze the external factors that influence an organization. Unlike internal audits that look at your team or cash flow, PEST looks outward at the world your business inhabits.
Political: Government actions, stability, trade restrictions, and tax policies.
Economic: Growth rates, interest rates, inflation, and exchange rates.
Social: Cultural trends, demographics, lifestyle changes, and population growth.
Technological: Innovation, automation, R&D activity, and technology incentives.
For an SME, the power of this framework lies in its ability to simplify complexity. Instead of trying to understand every global event, you focus on the factors that directly impact your supply chain, your customers, and your operational costs.
🗺️ Step 1: Preparation and Scope Definition
Before diving into data collection, you must define the boundaries of your analysis. A vague scope leads to vague insights. A well-defined scope leads to specific actions.
Define Your Time Horizon
Are you planning for the next quarter, the next fiscal year, or the next five years? Your time horizon dictates the depth of your research. Short-term planning focuses on immediate economic indicators and regulatory announcements. Long-term planning requires looking at demographic shifts and technological roadmaps.
Identify Key Stakeholders
Strategic planning is not a solitary activity. Gather a small group of key personnel. This might include your operations manager, sales lead, and finance officer. Each brings a unique perspective on how external factors affect their specific department.
Set Clear Objectives
What are you trying to achieve with this analysis? Is it to launch a new product? To enter a new market? To mitigate a specific risk? Knowing the end goal ensures the data you collect remains relevant.
📡 Step 2: Gathering Intelligence
Data collection is the foundation of the analysis. For an SME, resources for data acquisition are often limited. You do not need expensive market research firms. You need to utilize public information and internal experience effectively.
Primary Sources
Internal Records: Look at past sales data. Did sales drop when interest rates rose? Did customer inquiries change during a cultural holiday?
Customer Feedback: Surveys and direct conversations often reveal social trends before they appear in reports.
Supplier Communication: Your suppliers know about material shortages and price hikes before anyone else.
Secondary Sources
Government Publications: Census data, labor statistics, and trade reports are free and authoritative.
Industry Associations: These organizations often publish white papers and trend reports specific to your niche.
News Outlets: Local and national business news can highlight regulatory changes or economic shifts.
🏛️ Step 3: Analyzing Political Factors
Political factors relate to the influence of government on the economy. For SMEs, this is often the most volatile area. A change in policy can alter your cost structure overnight.
Key Questions to Ask
Are there upcoming elections that might change trade policies?
Is the current government stable?
Are there new tax incentives for businesses in your sector?
How strict are labor laws regarding hiring and firing?
Are there environmental regulations that affect your production?
Practical Example
Imagine you run a manufacturing SME. A new regulation is proposed regarding carbon emissions. Instead of waiting for it to pass, you analyze the likelihood of it passing. If it passes, how much will it cost to upgrade your machinery? If you can answer this now, you can budget for it or pivot your strategy before the law changes.
💰 Step 4: Analyzing Economic Factors
Economic factors determine the purchasing power of your customers and the cost of your capital. Inflation and interest rates are the heavy hitters here.
Key Questions to Ask
What is the current inflation rate in your target market?
Are interest rates rising or falling?
Is the local currency stable or fluctuating?
What is the unemployment rate, and how does it affect labor costs?
How is consumer confidence trending?
Impact on SMEs
When inflation is high, your input costs rise. You must decide whether to absorb the cost (reducing margins) or pass it on to customers (potentially reducing sales volume). When interest rates are high, borrowing money for expansion becomes expensive. You may need to rely on retained earnings instead of loans.
👥 Step 5: Analyzing Social Factors
Social factors are about the cultural environment. This includes demographic shifts, lifestyle trends, and consumer attitudes. This is often where the biggest opportunities for product innovation lie.
Key Questions to Ask
Is the population aging or growing younger?
Are customers becoming more health-conscious?
How does remote work affect your service delivery?
What are the current cultural values regarding sustainability?
Are there changing attitudes toward brand loyalty?
Practical Example
If you own a retail business, you might notice a shift in social values toward ethical sourcing. If you ignore this, you risk alienating a growing segment of your customer base. If you adapt your supply chain to meet this demand, you turn a social trend into a competitive advantage.
📡 Step 6: Analyzing Technological Factors
Technological factors cover the innovation landscape. This includes automation, digitalization, and the rate of technological obsolescence.
Key Questions to Ask
Is there a new technology that could disrupt your business model?
Are there government grants for technology adoption?
How quickly are your competitors adopting new software?
What are the cybersecurity risks facing your industry?
Is there a shift in how customers access information (e.g., mobile vs. desktop)?
Strategic Implication
Technology is not just about IT; it is about efficiency and reach. If a new platform allows you to reach customers cheaper than your current advertising method, you must evaluate the switch. Ignoring technological shifts is a common reason for SME failure.
📊 Step 7: Structuring Your Findings
Once you have gathered and analyzed the data, you need to organize it. A table helps visualize the balance of threats and opportunities.
Category | Factor | Impact Level (High/Med/Low) | Opportunity or Threat? | Potential Action |
|---|---|---|---|---|
Political | New Tax Compliance Rules | High | Threat | Hire consultant to review compliance |
Economic | Interest Rate Increase | Medium | Threat | Delay expansion plans |
Social | Growth in Remote Work | High | Opportunity | Invest in collaboration tools |
Technological | AI Automation Tools | Medium | Opportunity | Pilot AI for customer service |
This table forces you to make a decision. You cannot simply list a factor; you must assign an impact level and a potential action. This prevents the analysis from becoming just another report.
🧠 Step 8: Turning Insights into Action
This is the most critical step. Data without action is merely information. You have identified the factors; now you must integrate them into your business strategy.
Scenario Planning
Create different scenarios based on your PEST findings. For example:
Best Case: Interest rates stay low, and technology adoption is rapid. Plan for aggressive growth.
Worst Case: Inflation spikes, and regulations tighten. Plan for cost-cutting and efficiency.
Most Likely: Gradual economic growth with stable regulations. Plan for steady operations.
Adjusting KPIs
Your Key Performance Indicators should reflect the external environment. If economic forecasts suggest a recession, your sales targets might need adjustment. If social trends favor sustainability, your marketing KPIs should include sustainability metrics.
Resource Allocation
Decide where to spend your money based on the analysis. If the technological analysis shows a threat from automation, you might invest in training your staff to manage these tools rather than buying new hardware. If political analysis suggests a trade barrier, you might diversify your supplier base.
🔄 Step 9: Implementation and Monitoring
A PEST analysis is not a one-time event. The external environment changes continuously. You need a system to monitor these factors.
Set Review Cycles
Quarterly Review: Check economic indicators and competitor moves.
Annual Deep Dive: Conduct a full PEST analysis to update the strategic plan.
Assign Ownership
Designate someone to monitor specific areas. The finance lead might watch economic indicators, while the marketing lead watches social trends. This ensures someone is always watching the horizon.
Feedback Loops
When you implement a strategy based on your analysis, track the results. Did the new compliance process work? Did the investment in remote tools improve productivity? Use this feedback to refine your analysis for the next cycle.
⚠️ Common Pitfalls to Avoid
Even with a solid framework, SMEs often make mistakes that reduce the value of the analysis.
1. Analysis Paralysis
Collecting too much data without a clear decision point leads to inaction. Keep the scope tight. Focus only on factors that directly impact your business model.
2. Ignoring Internal Reality
External factors matter, but they must be weighed against your internal capabilities. You might see a great opportunity, but if you lack the capital or staff to pursue it, it is not a viable opportunity.
3. Static Thinking
Assuming the current trend will continue forever is dangerous. Always ask, “What could change this?” and “How long will this trend last?”
4. Groupthink
Ensure your planning team represents diverse views. If everyone agrees too quickly, you might be missing blind spots. Encourage constructive debate during the analysis phase.
💡 Final Thoughts on Strategic Agility
Conducting a PEST analysis is about building resilience. It is about preparing your SME to weather storms and seize calm weather when it arrives. By systematically scanning the Political, Economic, Social, and Technological landscape, you reduce uncertainty.
Remember, the goal is not to predict the future with 100% accuracy. That is impossible. The goal is to reduce the surprise factor. When a change happens, you are already aware of the signals that preceded it. You are ready to pivot.
Start small. Pick one area, such as Economic factors, and dig deeper this month. Then expand to the others. Over time, this process becomes part of your organizational culture. You will move from reacting to events to anticipating them.
Data is abundant. Action is scarce. This guide provides the structure to bridge that gap. Use the frameworks, tables, and questions provided here to turn the noise of the market into the signal of strategy. Your business will be stronger for it.

