


Strategic planning often stalls at the data collection phase. Many organizations conduct thorough PEST Analysis exercises, gathering vast amounts of information regarding Political, Economic, Social, and Technological factors. However, the real value lies not in the analysis itself, but in the transition from insight to execution. This guide outlines a structured approach to converting macro-environmental data into a tangible 90-Day Strategic Roadmap.
Too often, strategic documents gather dust on a server. To avoid this, leaders must treat the PEST output as the foundation, not the ceiling. By mapping external pressures to internal capabilities, you create a plan that is resilient and responsive. This document details the methodology for moving from high-level assessment to immediate action, ensuring resources are allocated effectively over the first quarter.
📊 Understanding the PEST Framework
Before constructing a roadmap, one must fully comprehend the variables that influence the business environment. The PEST acronym stands for Political, Economic, Social, and Technological. Each category represents a distinct set of external forces that impact decision-making. A robust analysis requires looking beyond surface-level headlines to understand underlying trends.
1. Political Factors
Political stability and government policy are primary drivers of operational risk. This section of the analysis should address:
- Regulatory Compliance: Are there new laws regarding data privacy, labor, or environmental standards that affect operations?
- Tax Policies: How might changes in corporate tax rates or incentives alter cash flow projections?
- Trade Barriers: Consider tariffs, quotas, or embargoes that could disrupt supply chains.
- Political Stability: Assess the risk of unrest or policy shifts in key markets.
For example, a shift in trade agreements might require a supplier relocation strategy. Identifying this early allows the roadmap to include contingency procurement plans.
2. Economic Factors
Economic conditions dictate purchasing power and capital availability. This analysis must be granular, focusing on the specific sectors in which the organization operates.
- Inflation Rates: High inflation impacts cost of goods sold and pricing strategies.
- Interest Rates: Rising rates increase the cost of borrowing, potentially slowing expansion projects.
- Exchange Rates: Volatility can erode margins for companies dealing in foreign currencies.
- Employment Levels: Labor market tightness affects hiring costs and wage expectations.
Understanding these metrics helps in setting realistic budget targets for the upcoming quarter. If inflation is projected to rise, cost-control measures must be prioritized in the initial 30 days.
3. Social Factors
Social trends reflect the cultural and demographic shifts within the target market. These factors influence consumer behavior and brand perception.
- Demographics: Aging populations or youth booms shift demand for specific products.
- Health Consciousness: Trends toward wellness can open or close specific market segments.
- Work Culture: Remote work expectations and diversity initiatives impact talent acquisition.
- Lifestyle Changes: How people spend their leisure time affects service industries.
If social data indicates a move toward sustainability, the roadmap should include initiatives to reduce carbon footprints or source ethically.
4. Technological Factors
Technological change is often the most volatile category. Innovation can render existing business models obsolete overnight.
- Automation: Emerging tools that replace manual labor.
- Research & Development: The rate of innovation in your specific industry.
- Infrastructure: Availability of high-speed internet or cloud services.
- Security: Cyber threats and the need for robust data protection.
Recognizing a technological shift early allows for investment in necessary upgrades before competitors gain a foothold.
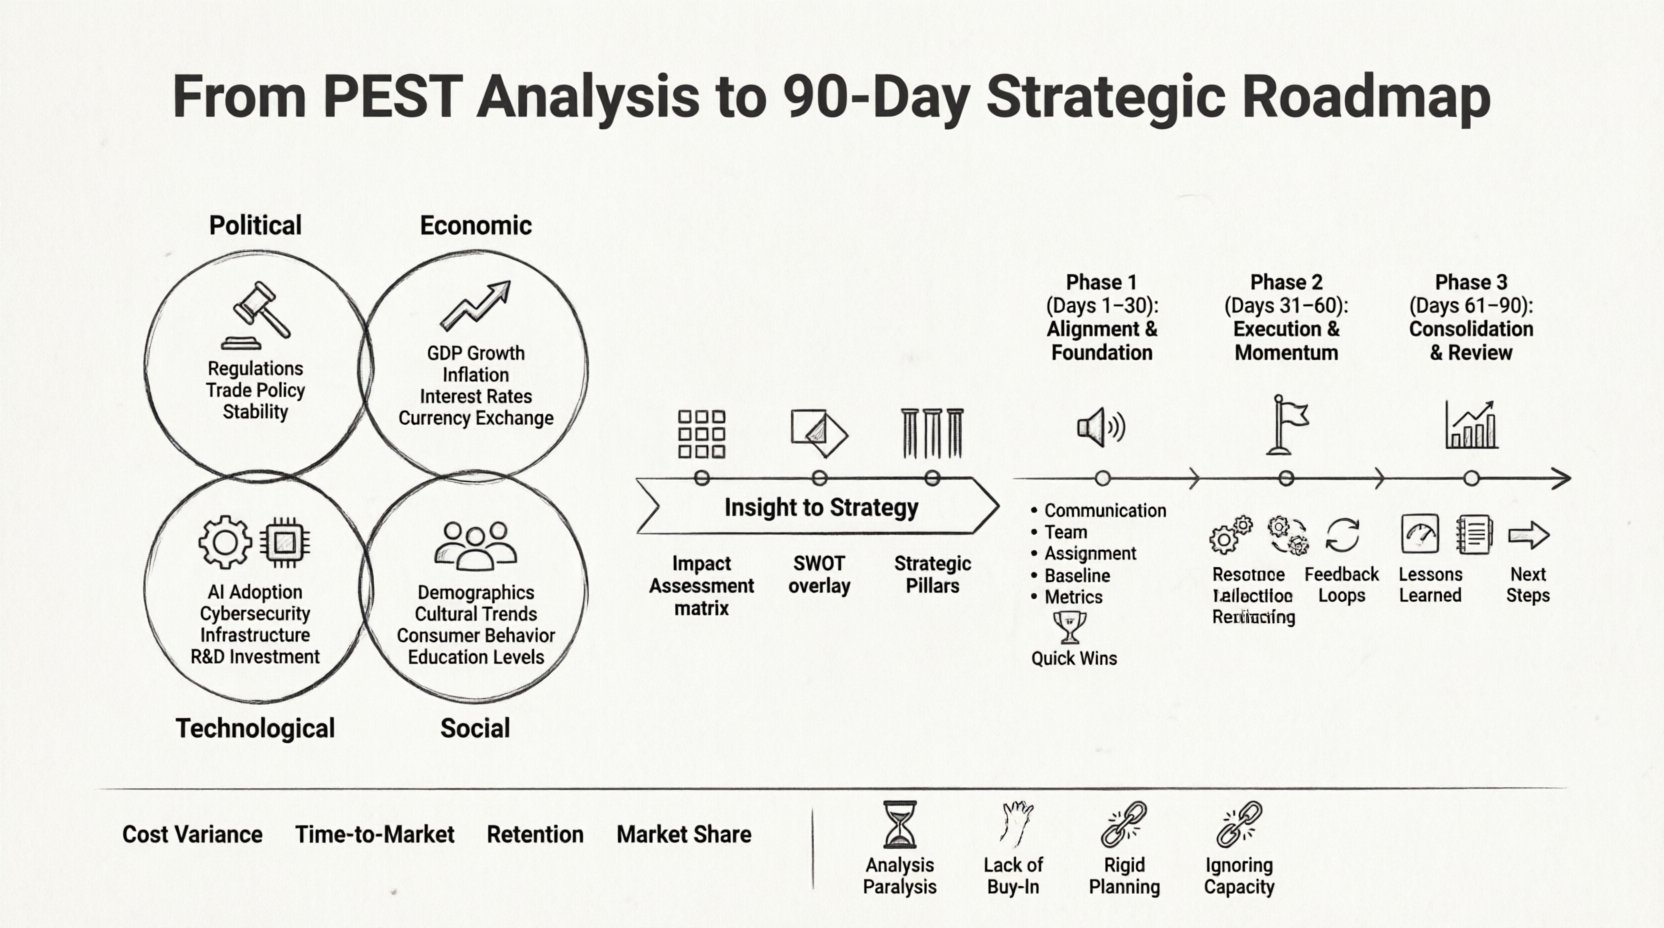
🔄 Bridging the Gap: From Insight to Strategy
Collecting data is passive; synthesizing it is active. The transition from PEST to Strategy requires a rigorous filtering process. Not every factor identified is actionable. The goal is to isolate the variables that directly impact the organization’s core objectives.
Step 1: Impact Assessment
Review every point identified in the PEST analysis. Ask two questions:
- How severe is the impact on our operations?
- How immediate is the timeline for this impact?
Create a matrix to score factors. High impact and immediate timeline factors take precedence in the 90-day plan. Low impact or long-term factors can be scheduled for quarterly reviews.
Step 2: SWOT Integration
Overlay the PEST findings onto your internal strengths and weaknesses. This creates a comprehensive view of opportunities and threats.
- Strengths: What internal assets allow you to capitalize on the opportunities?
- Weaknesses: Where does the organization lack the capacity to respond to threats?
- Opportunities: External trends that align with current capabilities.
- Threats: External risks that could hinder performance.
Step 3: Define Strategic Pillars
Based on the synthesis, establish 3 to 5 strategic pillars. These become the guiding principles for the 90-day roadmap. Examples include:
- Cost Optimization in Response to Inflation
- Workforce Upskilling for Automation Readiness
- Market Expansion into Emerging Demographics
🗓️ The 90-Day Strategic Roadmap Framework
A 90-day roadmap breaks a large strategic goal into manageable sprints. This timeline allows for quick feedback loops and adjustments. The plan is divided into three phases: Stabilization, Execution, and Review.
The following table outlines the focus for each phase.
| Phase | Timeframe | Primary Focus | Key Deliverables |
|---|---|---|---|
| Phase 1 | Days 1-30 | Alignment & Foundation | Resource allocation, team briefings, initial KPIs |
| Phase 2 | Days 31-60 | Execution & Momentum | Project milestones, mid-term review, adjustment |
| Phase 3 | Days 61-90 | Consolidation & Review | Final metrics, lessons learned, next quarter planning |
Phase 1: Days 1-30 (Alignment & Foundation)
The first month is critical for setting the tone. The focus here is communication and resource mobilization.
- Stakeholder Communication: Present the PEST findings to leadership. Ensure everyone understands the external pressures driving the strategy.
- Team Assignment: Assign owners to each strategic pillar. Clarity on who is responsible for what prevents gaps in execution.
- Baseline Metrics: Establish the current state of key performance indicators. You cannot measure improvement without a baseline.
- Quick Wins: Identify low-effort, high-impact actions that can be completed immediately. These build momentum and confidence.
During this phase, avoid scope creep. Stick strictly to the priorities identified in the synthesis step. If a new opportunity arises, evaluate it against the strategic pillars before adding it to the plan.
Phase 2: Days 31-60 (Execution & Momentum)
This is the workhorse phase. The plans developed in the first month are now being put into motion. The focus shifts to delivery and problem-solving.
- Milestone Tracking: Monitor progress against the timeline. Are tasks being completed on schedule?
- Resource Reallocation: If a specific area is lagging, move resources from completed tasks to support the bottleneck.
- Feedback Loops: Hold weekly check-ins with team leads. Gather qualitative data on what is working and what is obstructing progress.
- External Monitoring: Continue to watch the PEST factors. If a political or economic event occurs, adjust the roadmap accordingly.
Documentation is key during this phase. Record decisions made and the rationale behind them. This creates an audit trail for future reference.
Phase 3: Days 61-90 (Consolidation & Review)
The final month is about closing the loop. You need to assess the outcomes and prepare for the next cycle.
- Performance Review: Compare final metrics against the baseline established in Phase 1.
- Financial Reconciliation: Ensure all budget allocations were used correctly and within limits.
- Lessons Learned: Conduct a retrospective meeting. What barriers were encountered? How can they be removed next time?
- Next Steps: Draft the preliminary strategy for the next 90 days based on current results.
End the quarter with a formal report. This document should be concise, highlighting achievements and areas for improvement without unnecessary fluff.
📈 Metrics and KPIs for Success
To ensure the roadmap is effective, you must measure success objectively. Vague goals like “improve efficiency” are insufficient. Use specific Key Performance Indicators (KPIs) tied to the PEST drivers.
- Cost Variance: Measures the difference between budgeted and actual costs. Critical for Economic factors.
- Time-to-Market: Measures the speed of product or service delivery. Relevant for Technological factors.
- Employee Retention: Tracks stability within the workforce. Important for Social and Political factors.
- Market Share Growth: Indicates how well the company is capturing opportunities in the market.
Set targets for each KPI. For example, reduce operational costs by 5% within 90 days. This provides a clear benchmark for the team.
⚠️ Common Pitfalls and Mitigation Strategies
Even with a solid plan, execution often faces hurdles. Recognizing common pitfalls early can prevent costly mistakes.
1. Analysis Paralysis
Spending too much time on PEST analysis and delaying the roadmap. Mitigation: Set a hard deadline for the analysis phase. Once the data is gathered, move to the planning phase immediately.
2. Lack of Buy-In
Teams may not understand the strategic rationale. Mitigation: Involve key stakeholders in the synthesis process. When they help define the strategy, they are more likely to support it.
3. Rigid Planning
Refusing to adapt when external conditions change. Mitigation: Build flexibility into the roadmap. Schedule monthly reviews to adjust tactics if the PEST landscape shifts significantly.
4. Ignoring Internal Capacity
Setting goals that exceed the team’s bandwidth. Mitigation: Be realistic about resource availability. If the workload is too high, prioritize tasks and defer others to the next quarter.
🔍 Data Gathering Methodologies
To ensure the PEST analysis is accurate, use diverse data sources. Relying on a single source can lead to bias.
- Primary Research: Surveys and interviews with customers and employees. This provides direct insight into social and economic perceptions.
- Secondary Research: Industry reports, government publications, and financial news. Useful for economic and political data.
- Competitor Analysis: Reviewing how competitors respond to the same external factors. This highlights gaps in the market.
- Internal Data: Historical performance data to identify trends over time.
Triangulating data from these sources ensures a comprehensive view of the environment.
🤝 Stakeholder Alignment
Strategy fails when departments operate in silos. The 90-day roadmap must be a cross-functional effort.
- Finance: Ensures budgets align with strategic goals.
- Operations: Validates the feasibility of execution plans.
- Marketing: Ensures messaging aligns with social trends.
- HR: Manages talent acquisition and retention strategies.
Establish a steering committee that meets bi-weekly. This group oversees the roadmap and resolves conflicts between departments.
🔮 Future-Proofing the Strategy
The 90-day plan is not static. The environment changes continuously. To maintain relevance, the strategy must evolve.
- Scenario Planning: Develop “what-if” scenarios. If a specific political event occurs, what is the backup plan?
- Continuous Learning: Encourage teams to stay updated on industry news. Knowledge is a competitive advantage.
- Feedback Integration: Use the lessons from the 90-day cycle to refine the next one. Improvement is iterative.
By treating the roadmap as a living document, the organization remains agile. This agility is the primary defense against external volatility.
📝 Final Considerations for Leadership
Leadership plays a pivotal role in the success of this transition. The tone set by executives determines the level of engagement across the organization.
- Lead by Example: Demonstrate commitment to the strategic pillars in daily decisions.
- Remove Obstacles: Actively identify and clear roadblocks that prevent the team from executing the plan.
- Recognize Progress: Celebrate milestones. Recognition reinforces positive behaviors and keeps morale high.
- Communicate Transparently: Share both successes and failures. Honesty builds trust and accountability.
Implementing a 90-day strategic roadmap based on PEST analysis is a disciplined process. It requires patience, rigor, and a willingness to adapt. When executed correctly, it transforms abstract external threats into concrete internal actions. The result is an organization that is not just reacting to the market, but actively shaping its response to it.
Start with the data, build the plan, and execute with precision. This approach ensures long-term stability in an unpredictable world.

