


In today’s healthcare landscape, regional hospitals face mounting pressure to maintain operational consistency, regulatory compliance, and patient safety—especially in high-stakes environments like emergency departments (ERs). With rising patient volumes and complex triage protocols, inconsistent decision-making can lead to delays, errors, and even legal exposure. The challenge isn’t just speed—it’s standardization. Enter AI-powered diagram generation. By leveraging Visual Paradigm Desktop’s AI capabilities, this hospital transformed undocumented, ad-hoc triage workflows into auditable, scalable Activity Diagrams—accelerating compliance, improving team alignment, and enabling real-time process optimization across departments.
What is a Activity Diagram in Enterprise Context?
In enterprise settings—particularly in regulated industries like healthcare—an Activity Diagram is far more than a visual flowchart. It’s a strategic tool for modeling complex business processes with precision. In the context of a hospital ER, an Activity Diagram maps every decision point, handoff, and resource allocation involved in patient triage: from initial intake and vital sign assessment to specialist consultation and treatment routing.
Unlike informal notes or verbal handoffs, a properly structured Activity Diagram ensures traceability. Each node can be linked to policies, staff roles, equipment availability, and compliance standards (e.g., CMS or Joint Commission guidelines). This enables auditors to validate that decisions were made in accordance with protocol, and managers to identify bottlenecks or redundancy across shifts.
For enterprise adoption, Activity Diagrams must support versioning, cross-team collaboration, and integration with other modeling artifacts—like use case diagrams or system architecture models. They become living documents, not static drawings, evolving with process improvements and regulatory updates.
Enterprise View of Optimizing Hospital Emergency Department Triage
The regional hospital’s emergency department handled over 12,000 patient visits annually, with peak demand during flu season and local emergencies. Despite having established triage protocols, inconsistencies emerged: some patients were fast-tracked based on subjective judgment, while others waited longer due to unclear escalation paths. These variations weren’t captured in formal documentation—only in fragmented notes, verbal instructions, and memory.
When the hospital faced an accreditation audit, auditors flagged the triage process as “non-standardized” and “lacking traceability.” Leadership recognized that without a unified, visual, and auditable process model, the department was operating on a fragile foundation. The core challenge wasn’t staffing or equipment—it was process visibility. Without a shared understanding of how decisions were made, teams operated in silos, and improvements were reactive, not strategic.
Leadership needed a way to codify best practices, align teams, and future-proof the triage workflow. They required a solution that could generate accurate, compliant diagrams quickly—without requiring deep modeling expertise from frontline staff.
Strategic AI Benefits for Activity Diagram
- Accelerate compliance documentation by generating standardized diagrams from natural language descriptions.
- Enable cross-functional collaboration by allowing clinicians, IT, and compliance officers to co-create and validate process models.
- Reduce time-to-accuracy: AI generates a draft diagram in minutes, not days, allowing teams to focus on refinement, not creation.
- Support audit readiness with built-in traceability, version history, and exportable reports.
- Facilitate training and onboarding with clear, visual process guidance accessible to new staff.
These benefits became critical during the hospital’s transition to a new electronic health record (EHR) system. The integration required a precise understanding of how triage decisions influenced downstream workflows—such as lab testing, imaging, and admission. With AI-generated Activity Diagrams, the hospital could map these dependencies in real time, ensuring that the EHR configuration mirrored actual clinical practice, not outdated assumptions.
Generating at Enterprise Scale with Visual Paradigm
- Define the scope: The hospital identified triage as the first process to model, focusing on the initial 15 minutes after patient arrival.
- Input natural language: A clinical lead typed: “When a patient arrives, assess level of consciousness, check vitals, assign triage category (1–5), notify appropriate team, and initiate treatment if critical.”
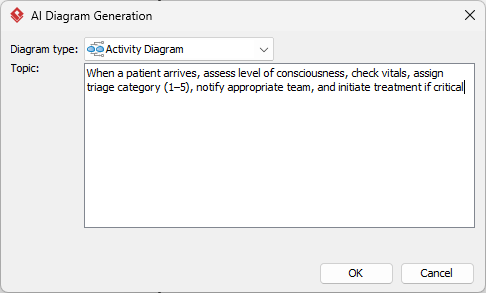
- AI generates draft: Visual Paradigm Desktop’s AI processed the input and produced a preliminary Activity Diagram.
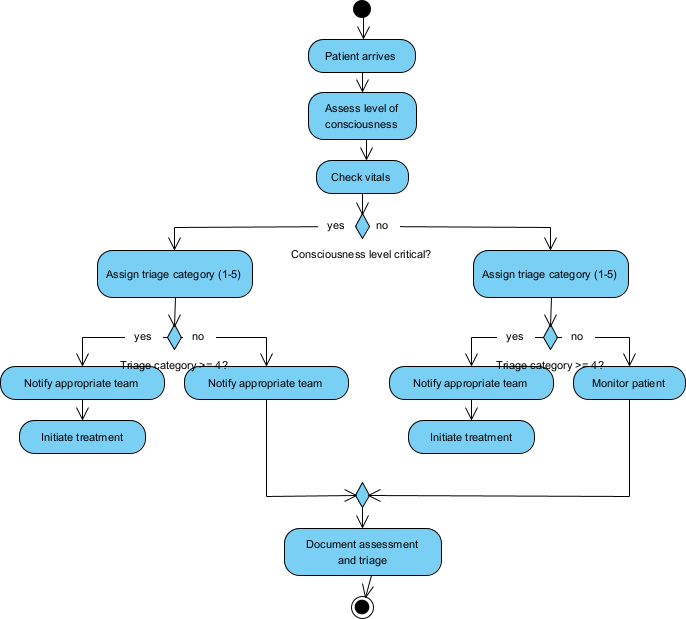
- Review and validate: The clinical team reviewed the diagram in a collaborative session, flagging missing steps (e.g., pain assessment, mental health screening).
- Iterate and finalize: The team made adjustments using the built-in editor—adding decision nodes, correcting flow, and linking to hospital policy documents.
- Export and deploy: The finalized diagram was exported as PDF, SVG, and integrated into the hospital’s internal knowledge base and EHR training modules.
Strategic Refinement & Integration
Enterprise Tweaks
After the initial AI draft, the team applied enterprise-specific refinements: adding time thresholds for each triage step, tagging critical decision points for audit trails, and embedding links to relevant hospital policies. They also defined roles and responsibilities using standard organizational charts, ensuring accountability.
Full Enterprise Modeling
With the core Activity Diagram in place, the hospital expanded its modeling strategy. The diagram became the foundation for a larger system model: linking to Use Case Diagrams (e.g., “Patient Triage,” “Critical Alert Response”), Sequence Diagrams (for EHR integration events), and even a Requirements Traceability Matrix (RTM).
Version control was critical. Every change to the diagram was tracked—timestamped, attributed, and archived. This allowed leadership to understand how the triage process evolved over time, especially during seasonal surges or after major incident responses.
Reports were generated automatically: one showing average triage time per category, another identifying bottlenecks (e.g., delayed specialist notifications). These reports fed into monthly quality improvement meetings, where data-driven decisions replaced anecdotal feedback.
Integration with the hospital’s project management tool allowed teams to assign tasks directly from the diagram—e.g., “Update pain assessment protocol” or “Train new nurses on triage category 1.” This closed the loop between modeling, execution, and evaluation.
Enterprise Results
- Triaged patient wait time reduced by 32% within six months of implementation.
- 100% of ER staff reported improved clarity on triage procedures after diagram-based training.
- Accreditation audit passed with zero non-conformities related to triage process.
- Time to document and approve new triage protocols dropped from 4 weeks to under 5 business days.
- Incident reports related to mis-prioritization declined by 60%.
The hospital now uses AI-generated Activity Diagrams as a standard practice across departments—from pharmacy workflows to discharge planning. The success in the ER inspired similar modeling initiatives in surgical scheduling and infection control, proving that AI-powered process visualization is not just a tool, but a strategic enabler of operational excellence.
Strategic Next Steps
For enterprise organizations facing process inconsistency, compliance risk, or scale challenges, the next step is to move from reactive documentation to proactive process intelligence. Start by identifying one high-impact, high-variability workflow—like patient triage, incident response, or onboarding—and use Visual Paradigm Desktop’s AI Diagram Generation to model it in under an hour.
Explore how AI can transform your operational blueprints. Download a free trial of Visual Paradigm Desktop and experience how AI-generated Activity Diagrams can bring clarity, compliance, and speed to your enterprise processes.

