
Mastering UML Sequence Diagrams: ATM Interaction Modeling with Visual Paradigm
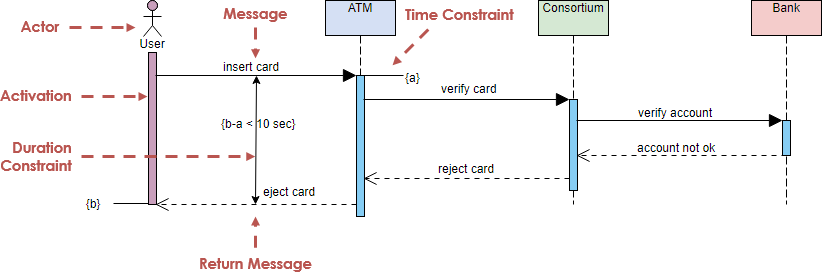
Sequence diagrams are a cornerstone of UML (Unified Modeling Language) used to describe the behavior of a system. They provide a dynamic view of the system, focusing on the time-ordered sequence of interactions between objects. In this tutorial, we will deconstruct a classic software engineering example: the interaction between a User and an Automated Teller Machine (ATM) system.
This guide will help you understand the anatomy of a sequence diagram, interpret time constraints, and visualize how to model these scenarios using Visual Paradigm, the premier UML modeling tool.
Understanding the Anatomy of a Sequence Diagram
To build a robust sequence diagram, one must first understand the fundamental building blocks. The diagram below illustrates a transaction flow where a user interacts with an ATM, which in turn communicates with a Consortium and a Bank.
- Actors and Objects: The diagram begins with the Actor (User) represented by a stick figure, and the system objects (ATM, Consortium, Bank) represented by rectangles with dashed lifelines extending downwards.
- Lifelines: The vertical dashed line extending from an object represents the existence of that object over time. It is the timeline for that specific participant.
- Messages: The horizontal arrows represent the messages passed between objects.
- Synchronous Messages: Solid lines with filled arrowheads (e.g.,
insert card,verify card) indicate a call where the sender waits for a response. - Asynchronous/Return Messages: Dashed lines with open arrowheads (e.g.,
eject card,account not ok) represent a return value or a response.
- Synchronous Messages: Solid lines with filled arrowheads (e.g.,
- Activation Bars: The thin vertical rectangles on the lifelines (colored blue in this diagram) indicate the period during which an object is performing an action or waiting for a response.
Modeling Time Constraints and Logic
One of the most powerful features of sequence diagrams is their ability to capture constraints. In our ATM example, we see specific notations that dictate the logic and timing of the system.
1. Time Constraints
The diagram explicitly defines a time constraint labeled {a}. This denotes the duration or the specific moment a message is sent or received. In the context of the ATM, this could represent the time the card is inserted before the system begins processing.
2. Duration Constraints
A critical aspect of the ATM’s user experience is speed. The diagram includes a duration constraint labeled {b-a < 10 sec}. This mathematical expression ensures that the interaction between the insert card and eject card messages does not exceed 10 seconds. If this constraint is violated, the system might trigger a timeout or a security alert.
3. Logic and Routing
The flow demonstrates a decision-making process. After the ATM sends a verify card message to the Consortium, the Consortium checks the validity. If the account is invalid, the Consortium sends an account not ok message back to the ATM, which then triggers the eject card action. This highlights how sequence diagrams map out error handling and alternative paths.
Implementing the Diagram in Visual Paradigm
Visual Paradigm offers a seamless environment for creating these diagrams. It is an all-in-one UML tool that supports enterprise-grade modeling. Here is how you would approach creating the ATM interaction scenario:
- Define Participants: In the Visual Paradigm toolbar, select the "Actor" tool to place the User, and the "Object" tool to place the ATM, Consortium, and Bank. Align them horizontally.
- Create Lifelines: Visual Paradigm automatically extends the lifelines (dashed lines) once you create the objects.
- Draw Messages: Use the "Sequence Message" tool to draw the solid lines for requests and the "Return Message" tool for the dashed lines. You can drag the lines from the source object to the target object.
- Add Constraints: To add the
{b-a < 10 sec}constraint, right-click on the message interaction or select the "Constraint" tool. Type the OCL (Object Constraint Language) expression or standard notation directly into the text box. - Refine Activation: The activation bars (the blue rectangles) are usually generated automatically when you draw a message from one object to another. If manual adjustment is needed, you can resize the bars on the lifelines to reflect the duration of the processing.
By utilizing Visual Paradigm, you ensure that your diagrams are not just static drawings but are part of a structured, model-driven architecture that can eventually be used to generate code or documentation.
Conclusion
Sequence diagrams are essential for visualizing the time-ordered interactions in a software system. By mastering the notation of messages, activation bars, and constraints, you can effectively communicate complex system behaviors to stakeholders. Using a powerful tool like Visual Paradigm makes the process of drafting, refining, and documenting these diagrams efficient and precise.