


In the landscape of business operations, clarity is currency. A business process model that is difficult to decipher fails its primary purpose: communication. When stakeholders, developers, and analysts look at a diagram, they should not need a decoder ring to understand the workflow. The standard for this communication is the Business Process Model and Notation (BPMN). However, simply using the syntax is not enough. You must adhere to strict rules for readability to ensure the model remains effective over time.
This guide outlines the essential principles for creating clear, maintainable, and professional process diagrams. These rules focus on reducing cognitive load and ensuring that the visual representation matches the logical reality of the business.
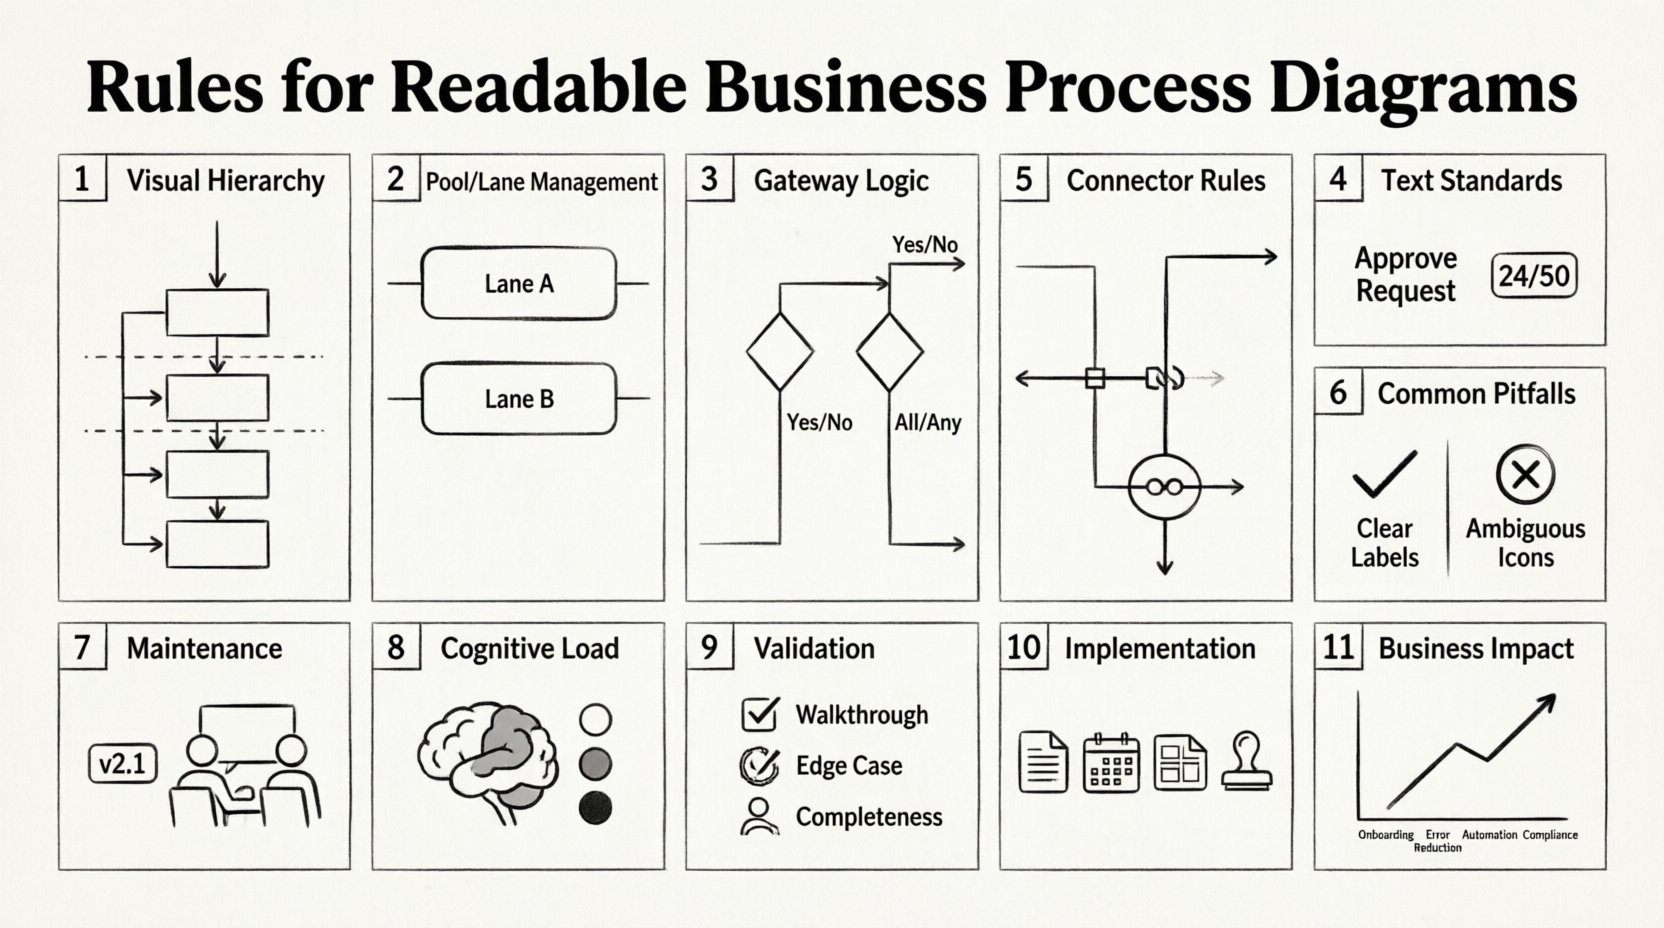
🔍 1. Visual Hierarchy and Layout
The first interaction a reader has with a diagram is visual scanning. If the layout is chaotic, the brain rejects the information before it is even understood. Establishing a clear visual hierarchy is the foundation of a readable diagram.
Directional Flow: Process flows should generally move from top to bottom or left to right. Consistency here allows the reader to predict where to look next.
White Space Management: Do not crowd objects together. Leave ample padding between distinct activities. White space acts as a visual separator, grouping related elements and distinguishing separate logical paths.
Alignment: Align objects horizontally and vertically. A jagged line of tasks suggests disorganization and makes tracing the path difficult.
Grouping: Use containers or sub-processes to group related activities. This reduces the number of visible elements at the top level of the diagram.
🏊 2. Pool and Lane Management
Pools represent participants, while lanes divide responsibilities within those participants. Mismanaging these structures leads to confusion regarding who is responsible for what.
Single Pool for Internal Processes: If a process involves only one organization, use a single pool with multiple lanes. Avoid creating unnecessary pools for departments within the same entity.
Consistent Lane Order: Arrange lanes logically. For example, place the “Customer” lane at the top or left, followed by “Sales,” “Finance,” and “Operations.” Keep this order consistent across all diagrams in the suite.
Limit Lane Crossing: A line crossing a lane boundary multiple times indicates a complex handoff. Try to minimize the number of times a flow crosses a lane boundary to reduce visual noise.
Message Flows vs. Sequence Flows: Use Message Flows for interactions between different pools. Use Sequence Flows for actions within the same pool. Mixing these up creates ambiguity about the context of the action.
🚦 3. Gateway Logic and Flow Control
Gateways control the branching and merging of paths. They are the decision points of the process. Incorrect usage here creates loops or dead ends that logic errors.
Use XOR for Exclusive Choices: If a path can go one way or another, but not both, use an Exclusive Gateway. Do not use an Inclusive Gateway for simple binary choices.
Use AND for Parallel Paths: Only use an Inclusive or Parallel Gateway if multiple paths must happen simultaneously. If only one happens, use XOR.
Balance Entry and Exit: Every gateway should have a clear entry and exit. Avoid gateways that merge paths without a clear condition for why they merged.
Label the Paths: Never leave a sequence flow leaving a gateway unlabeled. The reader must know the condition (e.g., “Approved”, “Rejected”) to understand the path.
📝 4. Text and Labeling Standards
Text is the primary way humans interpret symbols. If the text is vague, the symbol is meaningless.
Start with Verbs: Task labels should begin with an action verb (e.g., “Review Contract” rather than “Contract Review”). This emphasizes the activity.
Keep it Concise: Limit labels to 5 to 7 words. If a task requires a long description, move the detail to a task note or annotation, not the label itself.
Consistent Terminology: Use the same words for the same actions throughout the entire diagram. Do not use “Approve” in one section and “Sign Off” in another.
Avoid Technical Jargon: The diagram is often read by business stakeholders. Use business language, not database or code terminology.
🔗 5. Connector Rules and Sequence Flows
The lines connecting the objects define the flow of control. They must be clean and logical.
Orthogonal Routing: Connectors should be straight lines with right-angle turns. Avoid curved or diagonal lines unless absolutely necessary for layout.
No Overlapping Lines: If two sequence flows cross each other, add a “jump” symbol (a small arc) to indicate they are not connected at the intersection.
Minimize Crossing: Arrange tasks to minimize the number of times lines cross each other. This is known as reducing the “edge density” of the graph.
Event Connectivity: Ensure events connect properly. A Start Event should not have an incoming flow. An End Event should not have an outgoing flow.
⚠️ 6. Common Pitfalls Table
The following table highlights common errors found in process modeling and the corrective actions required to maintain readability.
❌ Common Mistake | ✅ Correct Approach |
|---|---|
Using dashed lines for sequence flows. | Use solid lines for standard flow; dashed is for message flows or associations. |
Overlapping text boxes with symbols. | Ensure all text is within the boundaries of the shape or moved to a tooltip. |
Gateways without conditions. | Label every outgoing flow with a condition unless it is a parallel split. |
Tasks spanning multiple lanes. | Assign tasks to the single lane responsible for executing them. |
Invisible or hidden tasks. | Make sure every task is visible. If hidden, use a collapsed sub-process explicitly. |
🔄 7. Maintenance and Lifecycle
A diagram is not a static artifact; it evolves as the business changes. Readability must be maintained through version control and review.
Versioning: If a process changes significantly, create a new version of the diagram rather than overwriting the old one. This preserves history.
Peer Review: Have a colleague who did not create the model review it. If they cannot trace the path without asking questions, the diagram is not readable.
Tooling Standards: Define standard fonts, sizes, and colors for your organization. A “Red” box should mean the same thing in every diagram created by the team.
Documentation: Keep a legend or key for any custom icons or color codes used. Do not assume the reader knows what a specific color means.
🧠 8. Cognitive Load and Visual Noise
Understanding the reader’s cognitive capacity is vital for diagram design. The human brain can only hold a limited number of items in working memory at once.
Chunking: Break complex processes into manageable chunks. Use sub-processes to hide detail until it is needed.
Color Usage: Limit the color palette. Use color to highlight exceptions or status (e.g., red for errors), not to decorate. Too many colors create visual noise.
Iconography: Stick to standard BPMN icons. Custom icons may look creative, but they require explanation and slow down reading speed.
Focus: Do not try to show every single exception in the main diagram. Create a separate “Exception Handling” diagram or use annotations.
🔎 9. Validation and Testing
Before publishing a process model, it must undergo validation. This ensures that the rules for readability translate into functional accuracy.
Walkthroughs: Walk through the process step-by-step. Does the flow make sense logically?
Edge Case Testing: Identify what happens if a step fails. Are there error paths defined?
Completeness Check: Ensure every Start Event has a corresponding End Event. There should be no dead ends in a valid process.
Reusability: Can this diagram be reused in a larger context? Modular design allows parts of a process to be inserted into other processes.
🛠 10. Implementation Guidelines
Applying these rules requires discipline. Here is a checklist for implementing a readable modeling standard within an organization.
Create a Style Guide: Document the rules for fonts, colors, and shapes.
Training: Train modelers on BPMN syntax and the specific readability rules of the organization.
Templates: Create blank templates with the correct layout and style pre-configured.
Audit: Periodically audit existing diagrams against the new standards and update them.
📈 11. Impact on Business Efficiency
The effort invested in readability yields tangible business returns. When diagrams are clear, the following outcomes occur:
Faster Onboarding: New employees can understand the process without weeks of training.
Fewer Errors: Ambiguity in process leads to operational errors. Clear diagrams reduce this risk.
Better Automation: Automated workflows rely on precise logic. Readable diagrams provide the clear requirements needed for automation.
Improved Compliance: Auditors can verify compliance faster when the process is transparent and well-documented.
🔚 Final Thoughts on Modeling Excellence
Building a process diagram is an act of translation. You are translating complex business reality into a visual language. The rules discussed here are not arbitrary restrictions; they are tools to bridge the gap between human understanding and machine logic. By prioritizing layout, consistency, and clarity, you create artifacts that serve the business long after the modeling session is complete.
Remember that a diagram is a living document. It requires care, attention to detail, and adherence to standards to remain useful. When you commit to these rules, you elevate the quality of your organization’s operational knowledge.
Focus on the reader. If they understand the flow, the model has succeeded.
? The Quick Guide")
