


In the landscape of organizational efficiency, clarity is the currency of success. When workflows span multiple departments, roles, or systems, the complexity increases exponentially. Visualizing these interactions is not merely a documentation exercise; it is a fundamental requirement for operational stability. Modeling Cross-Functional Processes with Swimlanes provides a structured method to map out responsibilities, interactions, and flow within a business environment. This approach, deeply rooted in Business Process Model and Notation (BPMN) standards, allows stakeholders to see the big picture while understanding specific duties.
The swimlane diagram is a specialized type of flowchart. It separates process steps into distinct horizontal or vertical categories. Each category, or “lane,” represents a specific actor, department, or system responsible for the tasks within that space. This visual separation prevents ambiguity regarding who does what. By organizing tasks into lanes, teams can identify handoffs, delays, and inefficiencies that might otherwise remain hidden in text-heavy documentation.
Understanding Swimlane Diagrams 📊
A swimlane diagram acts as a map for complex workflows. Unlike a standard flowchart that lists steps sequentially regardless of ownership, a swimlane diagram adds a layer of organizational context. This structure is particularly useful in BPMN, where clarity between participants is critical for process automation and improvement.
- Visual Segregation: Each lane is clearly defined, often with a label at the top or side.
- Task Assignment: Activities are placed inside the lane of the responsible entity.
- Flow Direction: Arrows connect tasks across lanes, indicating the transfer of information or material.
- Responsibility Matrix: The diagram inherently acts as a matrix showing who is accountable for each step.
When implemented correctly, these diagrams reduce the cognitive load on readers. Instead of scanning a long list of text to find who handles a specific approval, the eye simply moves to the relevant lane. This immediate visual cue accelerates comprehension and reduces errors in execution.
Why Cross-Functional Mapping Matters 🤝
Modern organizations rarely operate in silos. A single process often requires input from sales, legal, finance, and operations. Cross-functional mapping addresses the friction that occurs at the boundaries between these groups. Without a unified view, departments tend to optimize their own local performance at the expense of the overall process.
Here are the core advantages of adopting this modeling technique:
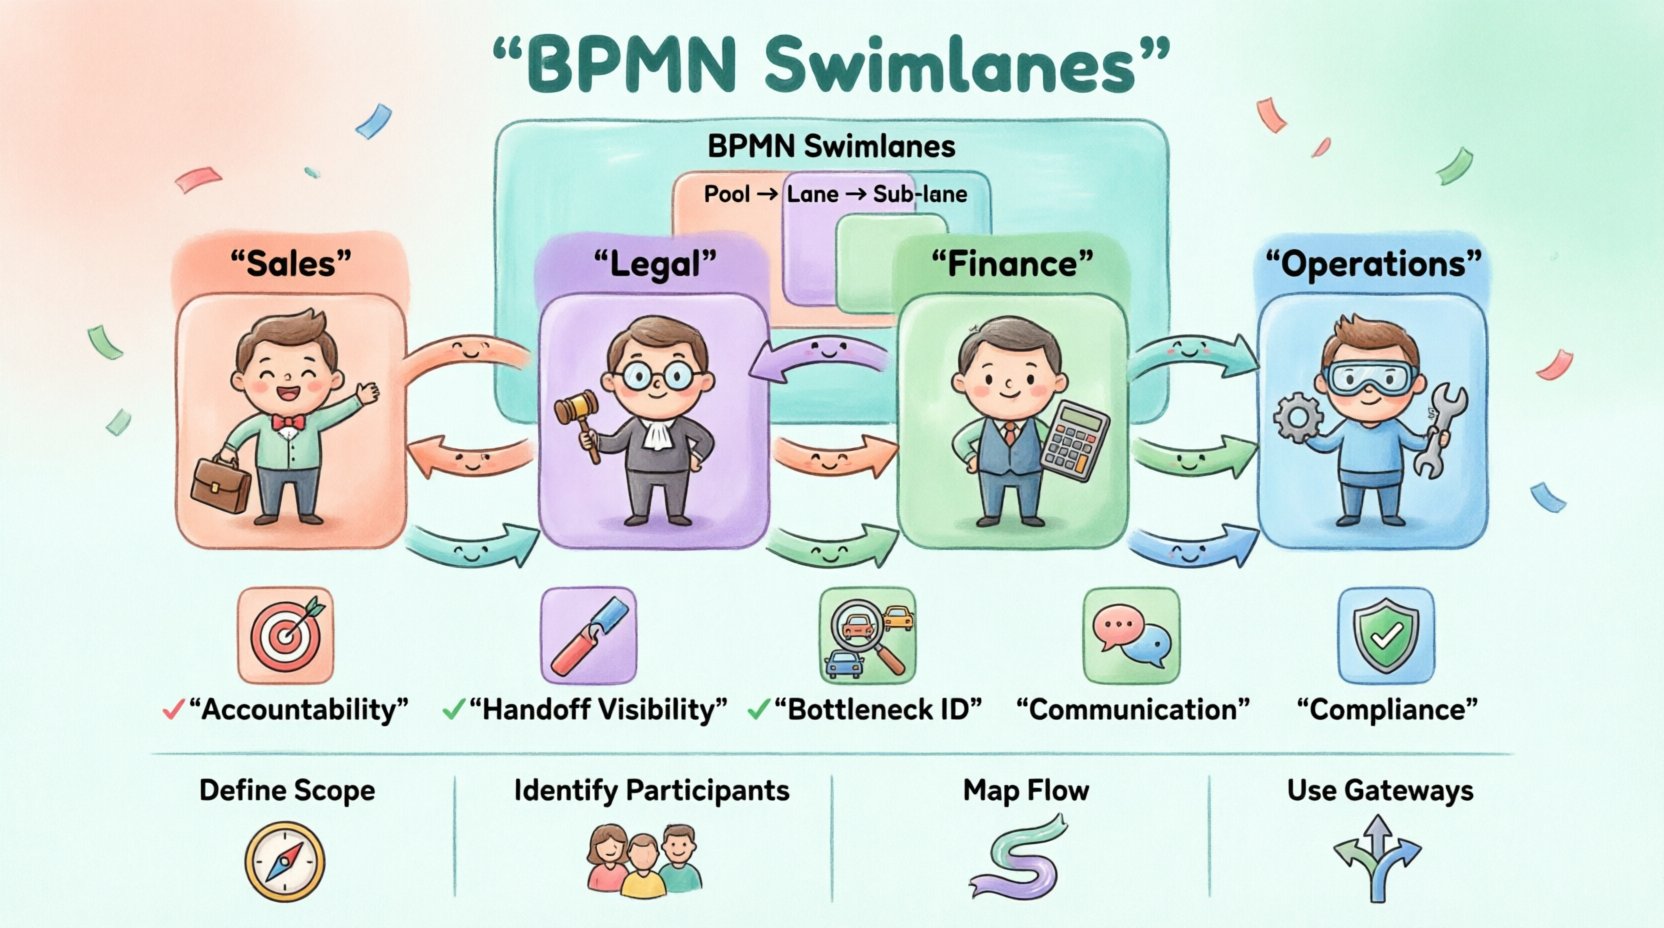
- Accountability: Every task has a designated home. It is clear who owns the output of a specific activity.
- Handoff Visibility: Crossings between lanes highlight handoffs. These are prime locations for errors, delays, or communication breakdowns.
- Bottleneck Identification: If a specific lane is crowded with tasks while others are empty, it may indicate an imbalance in resources or workload.
- Communication: A shared diagram serves as a single source of truth. It aligns expectations across different teams who might otherwise interpret the process differently.
- Compliance: Regulatory requirements often demand clear audit trails. Swimlanes provide a natural structure for tracking who performed which action and when.
BPMN Standards and Swimlanes 📏
Business Process Model and Notation (BPMN) is the industry standard for process modeling. Within the BPMN specification, the concept of the swimlane is formalized through Pools and Lanes.
- Pools: Represent a major participant in the process, such as a company, a customer, or an external partner. A process can have multiple pools to show interaction between different organizations.
- Lanes: Sub-divisions within a Pool. Lanes represent specific roles, departments, or systems within that organization.
Understanding the distinction between a Pool and a Lane is essential for accurate modeling. A Pool defines the boundary of the process execution. A Lane defines the internal responsibility. For example, a single Pool might represent “Order Fulfillment.” Inside that Pool, there could be Lanes for “Sales,” “Inventory,” and “Shipping.” This hierarchy allows for scalable diagrams that can be expanded as processes become more complex.
Constructing an Effective Diagram 🛠️
Building a swimlane diagram requires discipline. It is easy to create a cluttered mess that confuses more than it clarifies. To ensure the model remains useful, follow these structural guidelines.
- Define the Scope: Determine the start and end points of the process. Do not include unrelated activities that do not contribute to the specific outcome.
- Identify Participants: List all roles involved. Avoid generic labels like “User” unless the specific identity is irrelevant. Use specific titles like “Finance Manager” or “System A”.
- Order the Lanes: Arrange lanes logically. Horizontal lanes usually follow a left-to-right flow. Vertical lanes follow a top-to-bottom flow. Consider the natural reading direction of your audience.
- Map the Flow: Draw the sequence of tasks. Connect them with standard flow arrows. Ensure arrows do not cross lanes unnecessarily without purpose.
- Apply Gateways: Use decision points (gateways) to show branching paths. These often occur where a decision is made by a specific role.
It is also crucial to maintain consistency in notation. If a rounded rectangle represents a task in one lane, it must represent a task in all other lanes. Mixing shapes or symbols can lead to misinterpretation of the process logic.
Common Challenges and Solutions ⚠️
While swimlanes are powerful, they are not immune to pitfalls. Experienced modelers encounter specific issues regularly. Recognizing these problems early can save significant time during the redesign or implementation phase.
| Common Challenge | Impact | Recommended Solution |
|---|---|---|
| Too Many Lanes | Diagram becomes too wide or complex to read. | Group related roles into a single lane or create sub-processes. |
| Crossing Lines | Visual clutter makes flow direction hard to follow. | Reorder lanes or use sub-processes to hide complexity. |
| Ambiguous Handoffs | Unclear responsibility transfer between departments. | Define explicit triggers or documents passed between lanes. |
| Static vs Dynamic | Process changes faster than the diagram updates. | Implement a review schedule and version control for the model. |
One specific issue is the “Line Crossing” problem. When arrows jump back and forth between multiple lanes, the diagram becomes a tangled web. To mitigate this, consider using sub-processes. A sub-process allows you to collapse a complex section of the diagram into a single box, which can then be expanded later if needed. This keeps the high-level view clean while retaining the ability to drill down into details.
Analyzing Process Flow 📈
Once the diagram is created, the work is not finished. The diagram is a tool for analysis. You must interrogate the model to find areas for improvement. This involves looking at the flow of data and the timing of activities.
- Cycle Time: How long does the process take from start to finish? Look for lanes where tasks sit idle waiting for input from another lane.
- Touchpoints: Count the number of times a process crosses a lane boundary. High numbers of handoffs often correlate with higher error rates.
- Exception Handling: Does the diagram account for what happens when a task fails? Ensure there are paths for rework or escalation.
- Automation Potential: Identify tasks that are manual but repetitive. These are candidates for system automation, which could reduce the need for a specific lane.
When analyzing the flow, pay close attention to the decision points. If a gateway leads to a path that almost never happens, the logic may be flawed. Conversely, if a path is taken 99% of the time, the exception handling might be unnecessary complexity.
Measuring Success and Maintenance 🔄
A process model is a living document. It requires maintenance to remain accurate. As roles change or software systems are updated, the diagram must reflect the new reality. Without regular updates, the diagram becomes a historical artifact rather than a working tool.
To measure the success of the modeling effort, track the following metrics after implementation:
- Adoption Rate: Are teams using the diagram to guide their work? High adoption indicates the model is useful and accurate.
- Process Variance: Does the actual work match the diagram? Significant variance suggests the model needs adjustment or the process is being bypassed.
- Efficiency Gains: Have cycle times decreased or error rates dropped since the process was mapped and optimized?
Establish a governance process for the diagrams. Assign a process owner who is responsible for keeping the swimlane diagrams up to date. This person should coordinate with department heads to ensure that changes in their workflows are reflected in the master model. Regular review cycles, such as quarterly audits, help maintain the integrity of the process library.
Final Considerations for Implementation ✅
The goal of modeling cross-functional processes is not perfection, but clarity. A diagram that is 90% accurate and easy to understand is more valuable than a 100% accurate diagram that no one can read. Focus on the critical path and the major handoffs. Do not get bogged down in every single micro-task unless it is a high-risk activity.
By utilizing swimlanes within the context of BPMN, organizations gain a shared language for discussing operations. This shared language reduces friction, improves communication, and provides a solid foundation for continuous improvement. The visual nature of the swimlane allows stakeholders to align on the “who” and “how” without getting lost in the “what.” As processes evolve, the diagram evolves with them, ensuring that the organization remains agile and responsive to change.
Remember that the model serves the process, not the other way around. If a diagram becomes too complex to maintain, simplify the structure. Use grouping, sub-processes, and clear labeling to keep the information accessible. With a disciplined approach to modeling, cross-functional processes become predictable, efficient, and manageable assets for the business.

