


Every organization operates as a system of interconnected parts. When work moves from one team to another, friction often occurs. These moments of transfer, known as handoffs, are critical junctures in business processes. A smooth transition ensures continuity, while a broken link creates bottlenecks and errors. Using Business Process Model and Notation (BPMN) standards provides a universal language to map these transitions. This guide explores how to visualize handoffs between departments effectively to enhance operational clarity.
🔍 Why Handoff Visualization Matters
Process silos are a common challenge in large organizations. Departments often focus on their specific tasks without a clear view of the broader workflow. When a handoff is not clearly defined, several issues arise:
- Information Loss: Critical context may be lost when passing a task between teams.
- Delay: Uncertainty about ownership leads to waiting periods.
- Rework: Errors at the handoff point require the process to restart.
- Accountability Gaps: It becomes unclear who is responsible for the next step.
Visualizing these interactions using BPMN helps stakeholders see the flow of work. It transforms abstract verbal agreements into concrete diagrams. This clarity reduces ambiguity and sets expectations for every participant involved in the process.
🏗️ The Anatomy of a Process Handoff
In BPMN, a handoff is more than just an arrow connecting two boxes. It represents a transfer of responsibility, data, or authority. Understanding the components is essential for accurate modeling.
1. Pools and Lanes
The visual structure of a BPMN diagram relies on Pools and Lanes.
- Pools: Represent distinct participants or organizations. In an internal context, a pool might represent the entire company.
- Lanes: Sub-divisions within a pool. These typically represent departments, roles, or teams.
When work moves from one lane to another, it signifies a handoff between departments. The visual boundary of the lane is the critical area where the process changes ownership.
2. Sequence Flow vs. Message Flow
Not all connections are the same. The type of line used to connect tasks determines the nature of the handoff.
- Sequence Flow: Used for steps within the same participant or lane. It indicates the order of execution.
- Message Flow: Used when information is passed between different participants. This is the standard symbol for cross-departmental handoffs.
Using the correct flow type prevents confusion. A solid line implies immediate control transfer within a team. An open arrow implies a request or data exchange between separate entities.
📊 Common Handoff Scenarios and BPMN Elements
Different types of work require different modeling techniques. Below is a breakdown of common scenarios encountered during departmental transitions.
| Scenario | BPMN Element | Visual Indicator |
|---|---|---|
| Task Completion | End Task | Filled Circle |
| Request for Action | Intermediate Message Event | Dashed Circle with Envelope |
| Approval Needed | Exclusive Gateway | Diamond with X |
| Data Transfer | Data Object | Page Icon |
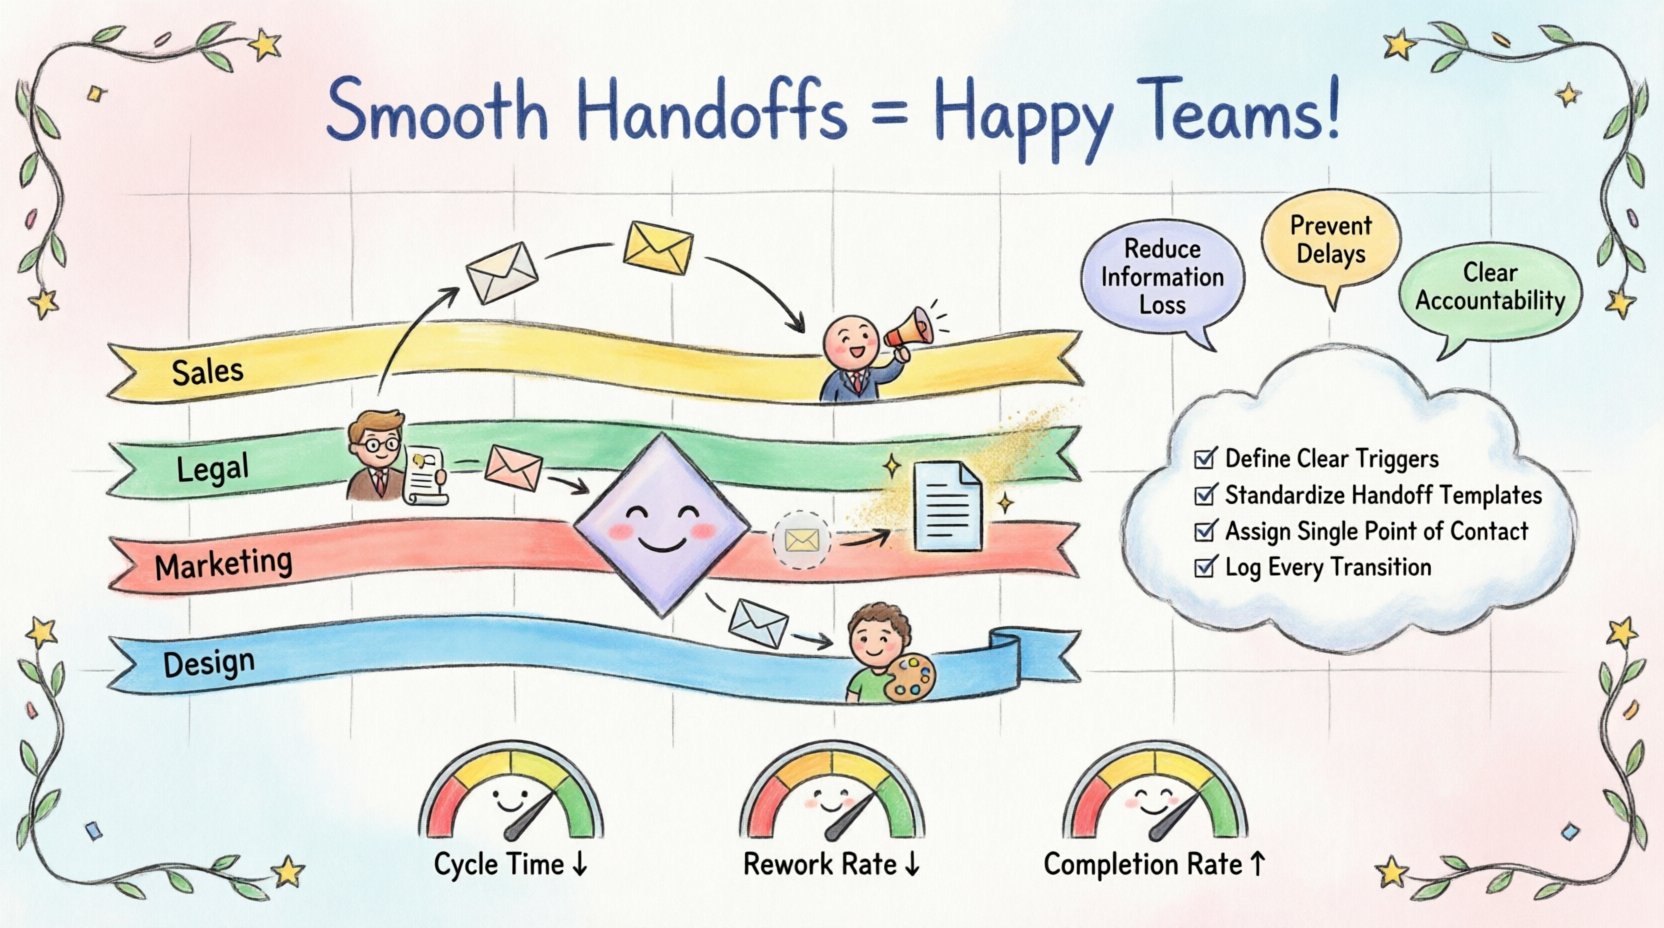
Recognizing these symbols helps in constructing a diagram that accurately reflects the reality of the business. For instance, if a sales team sends a contract to legal, a message flow connects the “Sales Task” to the “Legal Review Task”. If legal returns the contract for changes, a new message flow indicates the return path.
🛑 Handling Exceptions and Decision Points
A perfect process rarely exists. Real-world scenarios involve exceptions, rejections, and delays. Effective visualization must account for these possibilities.
Decision Gateways
When a department receives a request, they often need to make a decision. An Exclusive Gateway allows you to model different paths based on conditions.
- Path A: Request approved. Process continues to the next department.
- Path B: Request rejected. Process loops back to the originator for revision.
Labeling these paths clearly is vital. A simple “Yes” or “No” label is often insufficient. Descriptive labels like “Conditions Met” or “Requires Revision” provide better context.
Exception Events
Sometimes, a process stops unexpectedly. Intermediate Catching Events can capture interruptions. For example, if a handoff fails because a system is down, an error event can trigger a notification to the responsible manager.
Documenting these failure points ensures that the process is resilient. It moves the focus from ideal execution to robust operation.
📝 Data Objects and Information Exchange
Handoffs are often about data, not just tasks. What information accompanies the work as it moves between departments? In BPMN, Data Objects represent this information.
- Input Data: What the receiving department needs to start their task.
- Output Data: What the sending department provides upon completion.
Visualizing data objects alongside tasks clarifies what is physically or digitally transferred. This prevents the “black box” effect where one department assumes the other has all necessary context.
For example, when Marketing sends a campaign brief to Design:
- Task: Create Visual Assets.
- Data Object: Brand Guidelines, Campaign Brief, Target Audience Report.
By placing these objects near the Message Flow, the diagram explicitly states what must travel with the work item.
🤝 Collaborative Modeling Strategies
Creating an accurate BPMN diagram requires input from the departments involved. Relying solely on process analysts often leads to gaps in understanding. The following strategies ensure stakeholder alignment.
- Workshops: Gather representatives from each department to review the draft diagram.
- Validation: Ask department heads to confirm that the flow matches their daily reality.
- Role Clarity: Ensure every lane has a defined owner or role.
- Iterative Refinement: Treat the diagram as a living document that evolves with the business.
This collaborative approach builds ownership. When departments see their specific constraints and requirements reflected in the model, they are more likely to adhere to the process.
⚠️ Common Pitfalls in Handoff Visualization
Even experienced modelers make mistakes. Being aware of common errors helps maintain diagram integrity.
1. Overcomplicating the Flow
Trying to show every single micro-step can obscure the main handoff points. Keep the high-level view clear. Drill down into sub-processes only when necessary for detail.
2. Ignoring Timing
Some handoffs are immediate, while others wait for a specific time. Standard BPMN does not capture time explicitly in the basic symbols. However, you can annotate timing expectations near the message flow.
3. Ambiguous Labels
Labels like “Process” or “Task” are too generic. Use action-oriented verbs like “Approve Invoice” or “Ship Product”. Specificity aids understanding.
4. Missing Roles
Every lane should represent a person or team. If a lane is empty, the process has a gap. Ensure every handoff destination has a defined recipient.
📈 Measuring Handoff Success
Once the process is visualized and implemented, you need metrics to evaluate performance. The diagram itself does not measure success, but it provides the baseline for measurement.
- Cycle Time: How long does it take for work to move from Lane A to Lane B?
- Rework Rate: How often does work return from Lane B to Lane A?
- Completion Rate: What percentage of handoffs are completed without error?
Tracking these metrics allows you to identify which handoffs are weak points. You can then focus improvement efforts on those specific transitions.
🚀 Future Considerations
As technology evolves, the nature of handoffs changes. Automation tools can now execute parts of a process without human intervention. In BPMN, this is often represented by Service Tasks.
When a task is automated, the handoff becomes system-to-system. The visualization must reflect this shift. Instead of a human receiving a task, a system receives a trigger. Understanding this distinction is crucial for modern process design.
Additionally, the integration of data analytics into process models is becoming standard. Linking the BPMN diagram to real-time data dashboards allows managers to see live handoff status. This bridges the gap between the static model and the dynamic reality of operations.
🛠️ Implementation Checklist
Before finalizing a process map, review the following checklist to ensure all handoffs are clear.
- ☐ Are all lanes labeled with specific department names?
- ☐ Is every handoff represented by a Message Flow?
- ☐ Are data objects clearly identified for each transfer?
- ☐ Are exceptions and rejection paths modeled?
- ☐ Have stakeholders validated the diagram?
- ☐ Are task descriptions action-oriented and specific?
Following this checklist ensures that the visualization serves its purpose. It acts as a reliable blueprint for operations, training, and continuous improvement.
🔗 Summary of Best Practices
Creating effective visualizations for departmental handoffs requires attention to detail and a deep understanding of BPMN standards. By using the right symbols, involving stakeholders, and focusing on data flow, organizations can reduce friction.
The goal is not just to draw a diagram, but to create a shared understanding of how work moves through the enterprise. When departments can see the whole picture, collaboration improves. Errors decrease. Efficiency increases. This structured approach to process mapping is foundational for operational excellence.

