


Unified Modeling Language (UML) serves as the backbone for software architecture and design documentation. It provides a standardized visual language that allows developers, stakeholders, and system architects to communicate complex systems effectively. Understanding UML symbols and notations is essential for translating abstract ideas into concrete blueprints. This guide breaks down the core components, diagrams, and relationship markers used in modern software engineering.
What is UML? 🤔
UML is a general-purpose modeling language used to specify, visualize, construct, and document the artifacts of software systems. It is not a programming language but rather a graphical notation. By using visual representations, teams can reduce ambiguity and ensure that everyone involved in the project shares a common understanding of the system structure and behavior.
When you learn UML, you are learning a universal language for system design. It helps in:
Clarifying requirements early in the development lifecycle 📝
Documenting complex logic without relying solely on code 🧠
Facilitating communication between technical and non-technical team members 🤝
Identifying potential design flaws before implementation begins ⚠️
Structural vs. Behavioral Diagrams 🏗️
UML diagrams are generally categorized into two main groups: Structural and Behavioral. Structural diagrams focus on the static aspects of a system, while behavioral diagrams focus on the dynamic aspects.
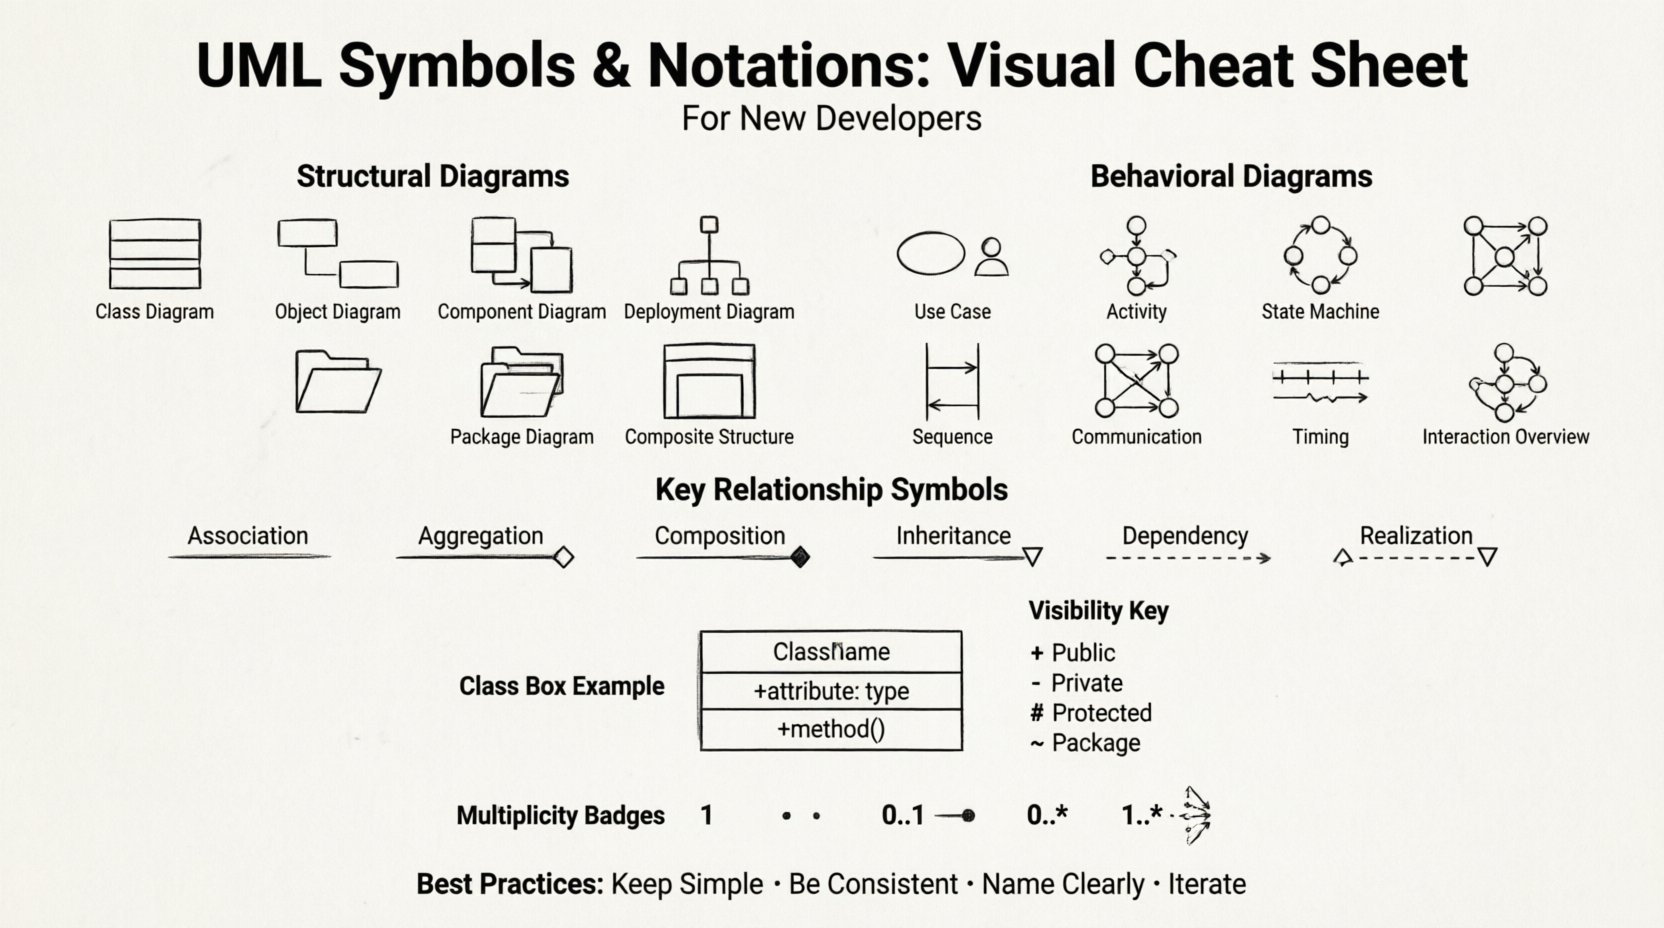
1. Structural Diagrams
These diagrams describe the static structure of a system. They show what the system consists of and how components are related.
Class Diagram: The most widely used diagram in UML. It shows classes, their attributes, operations, and relationships. It is the foundation for object-oriented design.
Object Diagram: Represents a snapshot of the system at a specific point in time. It shows instances of classes and their relationships.
Component Diagram: Describes the organization and dependencies between software components. It is useful for high-level architecture.
Deployment Diagram: Visualizes the hardware architecture and software deployment. It shows nodes and the artifacts deployed on them.
Package Diagram: Organizes elements of the model into groups or packages to manage complexity.
Composite Structure Diagram: Shows the internal structure of a class, including parts and connectors.
2. Behavioral Diagrams
These diagrams describe the dynamic behavior of a system. They show how the system acts in response to events.
Use Case Diagram: Illustrates the interactions between actors (users or external systems) and the system itself. It defines the scope of the system.
Activity Diagram: Similar to a flowchart, it models the flow of control or data from activity to activity. It is often used for business processes.
State Machine Diagram: Shows the different states an object can be in and the transitions between those states triggered by events.
Sequence Diagram: Shows interactions between objects in a specific order over time. It is crucial for understanding message passing.
Communication Diagram: Focuses on the relationships between objects rather than the sequence of messages.
Timing Diagram: Focuses on the behavior of objects within a specific time interval.
Interaction Overview Diagram: Combines activity diagrams and interaction diagrams to show high-level control flow.
Deep Dive into Common Notations 📐
Understanding the specific symbols is key to reading and creating UML diagrams. Below is a detailed breakdown of the most frequently used notations.
Class Diagram Notations
A class is typically represented by a rectangle divided into three compartments:
Top Compartment: The name of the class.
Middle Compartment: Attributes (data members).
Bottom Compartment: Operations (methods).
Visibility is indicated by specific symbols placed before the attribute or operation name:
+: Public (accessible from anywhere).
–: Private (accessible only within the class).
#: Protected (accessible within the class and its subclasses).
~: Package (accessible within the package).
Relationship Notations
Relationships define how elements interact. The line type and arrowhead indicate the nature of the connection.
Relationship Type | Symbol Description | Meaning |
|---|---|---|
Association | Solid line | A structural relationship where objects are connected. |
Aggregation | Line with a hollow diamond | “Has-a” relationship; the whole can exist without the part. |
Composition | Line with a filled diamond | Strong “has-a” relationship; the part cannot exist without the whole. |
Inheritance (Generalization) | Line with a hollow triangle | “Is-a” relationship; a subclass inherits from a superclass. |
Dependency | Dashed line with an open arrow | One element uses or depends on another temporarily. |
Realization | Dashed line with a hollow triangle | An interface is implemented by a class. |
Sequence Diagram Details ⏱️
Sequence diagrams are critical for understanding the flow of messages between objects. Key symbols include:
Life Lines: Vertical dashed lines representing the existence of an object over time.
Activation Bars: Rectangles on the life line indicating when an object is actively performing an operation.
Messages: Horizontal arrows showing method calls or signals between objects.
Return Messages: Dashed arrows pointing back to the caller.
Combined Fragments: Boxes labeled with keywords like alt, opt, or loop to show conditional or iterative logic.
Use Case Diagram Symbols
Use case diagrams map out user interactions. The primary symbols are:
Stick Figure: Represents an Actor (user or external system).
Oval: Represents a Use Case (a specific functionality).
Solid Line: Connects an actor to a use case.
Arrow with «extend»: Indicates optional behavior.
Arrow with «include»: Indicates mandatory behavior required by another use case.
Understanding Multiplicity 🔢
Multiplicity defines how many instances of one class relate to one instance of another class. It is usually written near the end of an association line.
1: Exactly one.
0..1: Zero or one (optional).
0..*: Zero or more.
1..*: One or more.
0..10: Between zero and ten.
For example, in a relationship between a Customer and an Order, the notation might be 1 on the Customer side and 0..* on the Order side. This means one customer can have zero or many orders, but each order belongs to exactly one customer.
Best Practices for Diagramming ✅
Creating effective UML diagrams requires discipline and adherence to certain standards. Follow these guidelines to ensure clarity:
Keep it Simple: Do not try to model the entire system in one diagram. Break complex systems into manageable views.
Consistency is Key: Use the same notation style throughout all diagrams in your project. Mixing notations confuses readers.
Name Clearly: Use descriptive names for classes, attributes, and relationships. Avoid abbreviations unless they are industry-standard.
Focus on the Audience: A diagram for a project manager might differ in detail from one intended for a developer. Tailor the level of abstraction accordingly.
Iterate: UML is not a one-time task. Update your diagrams as the system evolves to maintain accuracy.
Use White Space: Allow enough space between elements to prevent clutter. A crowded diagram is hard to read.
Layer Your Diagrams: Start with high-level architectural views before diving into detailed sequence or class diagrams.
Common Mistakes to Avoid ❌
Even experienced developers can fall into traps when creating diagrams. Watch out for these common pitfalls:
Over-Modeling: Creating too many diagrams for trivial features wastes time. Focus on high-value areas.
Ignoring Lifecycle: Forgetting to show object creation and destruction in sequence diagrams can lead to runtime errors.
Mixing Levels: Do not mix high-level business logic with low-level database schema details in the same diagram.
Incorrect Relationships: Confusing composition with aggregation is a frequent error. Remember the difference in ownership and lifecycle.
Missing Multiplicity: Failing to define cardinality can lead to ambiguity about how many instances are allowed.
Unclear Labels: Using generic labels like “Process” or “Do Stuff” instead of specific verbs like “Validate Input” or “Generate Report”.
Integrating UML into the Workflow 🔄
UML is not just a documentation exercise; it is a design tool. Here is how to integrate it effectively:
Requirement Analysis: Use Use Case diagrams to validate requirements with stakeholders.
System Design: Use Class and Component diagrams to plan the architecture.
Implementation: Use Sequence and Activity diagrams to guide the coding of complex logic.
Testing: Use State Machine diagrams to ensure all state transitions are covered by test cases.
Maintenance: Use updated diagrams to help new team members understand the codebase.
Advanced Notations and Extensions 🚀
Beyond the standard symbols, UML supports extensions through stereotypes, tagged values, and constraints.
Stereotypes: Indicated by text in guillemets (e.g., <<entity>>). They allow you to extend the vocabulary of UML for specific domains.
Tagged Values: Key-value pairs attached to elements (e.g.,
{readonly}). They provide additional metadata about the model element.Constraints: Written in curly braces (e.g.,
{max=10}). They specify rules that must be followed, such as data validation limits.
Final Considerations 📝
Mastering UML is a journey of continuous learning. The symbols and notations are tools to aid communication, not rules to restrict creativity. As you gain experience, you will find yourself relying less on the cheat sheet and more on your intuition for design.
Remember that the goal of UML is clarity. If a diagram confuses more than it clarifies, simplify it. The best diagram is the one that effectively conveys the intended message to the target audience. By adhering to standard symbols and following best practices, you ensure that your software architecture remains maintainable and understandable over time.
Start applying these concepts to your current projects. Draw the diagrams before writing the code. You will likely find that the design process becomes more structured and the final code more robust. Embrace the visual language of software development and watch your design skills grow.
