


Unified Modeling Language (UML) serves as the standard visual language for specifying, constructing, and documenting the artifacts of software systems. For anyone entering the field of systems analysis or software design, understanding UML is not merely optional—it is a fundamental requirement for clear communication. This checklist outlines the core concepts, diagrams, and notations that form the backbone of effective system modeling.
What is UML? 🏗️
UML is a general-purpose modeling language in the field of software engineering. It provides a standard way to visualize the design of a system. Rather than relying solely on text-based requirements, UML allows architects and developers to create blueprints that represent the system’s structure and behavior.
The language was developed in the 1990s to address the confusion caused by having multiple, competing modeling methods. Since then, it has become the industry standard. It is important to understand that UML is not a method itself; it is a notation system used within various methods. It does not dictate how you should build software, but rather how you should represent it visually.
Key benefits include:
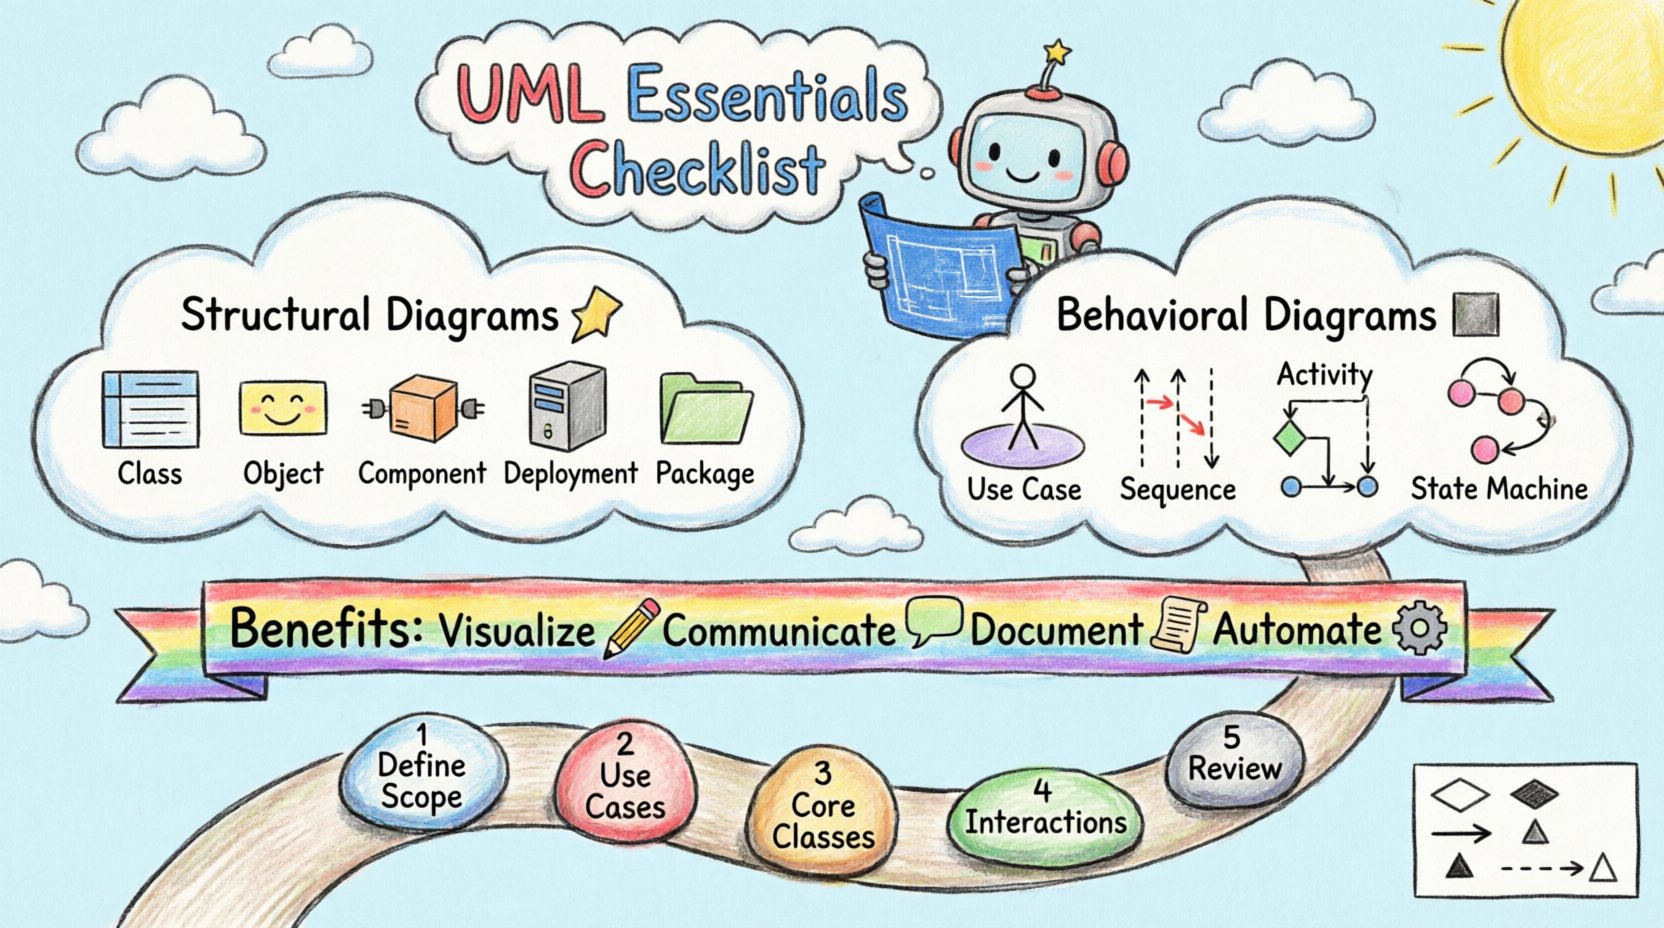
- Visualization: Complex systems become easier to understand when drawn out.
- Communication: Stakeholders, developers, and testers share a common vocabulary.
- Documentation: Models serve as permanent records of design decisions.
- Automation: Tools can generate code skeletons or documentation from diagrams.
The Two Main Categories: Structure vs. Behavior 🔄
UML diagrams are broadly divided into two groups. Understanding this distinction is the first step in selecting the right tool for the job.
1. Structural Diagrams
These diagrams describe the static aspects of a system. They show the things that make up the system. Think of this as the anatomy of the software. It remains the same regardless of the time or the actions taking place.
- Classes
- Objects
- Interfaces
- Nodes
2. Behavioral Diagrams
These diagrams describe the dynamic aspects of a system. They show the things that happen inside the system. This is the physiology of the software, representing interactions and flows over time.
- Use Cases
- Activities
- Interactions
- State Changes
Structural Diagrams: The Foundation 🧩
Structural diagrams define the components and relationships that persist throughout the lifecycle of the system. Below is a detailed breakdown of the most critical ones.
Class Diagram
The class diagram is the most commonly used diagram in UML. It captures the static structure of the system by showing classes, their attributes, operations, and relationships.
- Classes: Represented by rectangles divided into three compartments (Name, Attributes, Operations).
- Attributes: Data held by the class (e.g., price, name, status).
- Operations: Methods or functions available to the class (e.g., calculateTotal(), save()).
- Relationships: Lines connecting classes to define how they interact.
Object Diagram
While a class diagram shows the template, an object diagram shows the specific instances at a particular moment in time. It is essentially a snapshot of the system.
- Used to verify the validity of a class diagram.
- Shows actual data values rather than data types.
- Helps in debugging specific scenarios.
Component Diagram
This diagram models the physical components of a system. It groups code into logical units that can be deployed independently.
- Components: Represented by a rectangle with two smaller rectangles on the left side.
- Interfaces: Show how components interact with each other (provided and required).
- Dependencies: Show how one component relies on another.
Deployment Diagram
This diagram visualizes the hardware and software infrastructure. It maps the software components to the physical nodes where they run.
- Nodes: Physical devices like servers, laptops, or routers.
- Artifacts: Physical files deployed on the nodes.
- Connections: Communication paths between nodes.
Package Diagram
Used to organize elements of the model into groups. This is crucial for managing complexity in large systems.
- Packages: Represented by a folder icon.
- Namespace: Prevents naming conflicts between classes in different packages.
- Dependencies: Show which packages depend on others.
Behavioral Diagrams: The Flow of Action 🎬
Behavioral diagrams describe how the system behaves in response to events. These are essential for understanding the logic and user interactions.
Use Case Diagram
This diagram captures the functional requirements of the system. It defines who interacts with the system and what they want to achieve.
- Actors: Stick figures representing users or external systems.
- Use Cases: Ovals representing specific functionalities (e.g., “Login”, “Generate Report”).
- System Boundary: A box enclosing the use cases to define scope.
- Relationships: Lines connecting actors to use cases.
Sequence Diagram
A sequence diagram shows how objects interact with each other over time. It is one of the most detailed interaction diagrams.
- Lifelines: Vertical lines representing objects or actors.
- Messages: Horizontal arrows showing data or commands passed between objects.
- Activation Bars: Rectangles on lifelines showing when an object is active.
- Focus of Control: Indicates the current flow of execution.
Activity Diagram
Similar to a flowchart, this diagram models the flow of control from activity to activity. It is useful for describing business processes.
- Initial State: A solid black circle.
- Final State: A solid circle with a ring around it.
- Decision Nodes: Diamonds representing conditional logic.
- Swimlanes: Organize activities by responsible party or component.
State Machine Diagram
This diagram models the life cycle of a single object. It shows the different states an object can be in and how it transitions between them.
- States: Rounded rectangles representing conditions (e.g., “Open”, “Closed”).
- Transitions: Arrows moving from one state to another.
- Events: Triggers that cause a transition (e.g., “User Clicks Submit”).
Key Notations and Symbols 📝
Consistency in notation is vital for the diagram to be readable by others. The following table summarizes the most common symbols used across UML diagrams.
| Symbol | Name | Usage |
|---|---|---|
| Class | Rectangle | Represents a class or object with compartments for name, attributes, and methods. |
| Association | Line | A structural relationship between objects (e.g., a person owns a car). |
| Aggregation | Hollow Diamond | A weak “whole-part” relationship (e.g., a department has employees). |
| Composition | Filled Diamond | A strong “whole-part” relationship where parts cannot exist without the whole. |
| Inheritance | Line with Hollow Triangle | Shows an “is-a” relationship (e.g., a Dog is a Mammal). |
| Dependency | Dashed Line with Arrow | Shows that one element uses or depends on another. |
| Realization | Dashed Line with Hollow Triangle | Shows that a class implements an interface. |
When to Use Which Diagram? 🤔
Selecting the correct diagram type depends on the specific question you are trying to answer about the system. Using the wrong diagram can lead to confusion or missed details.
| Diagram Type | Primary Question | Best Used For |
|---|---|---|
| Use Case | What does the system do? | Capturing functional requirements and user goals. |
| Class | What are the data structures? | Designing the database schema and object-oriented code. |
| Sequence | How do objects talk? | Designing complex logic and API interactions. |
| Activity | How does the process flow? | Mapping business workflows and algorithms. |
| State Machine | How does the object change? | Modeling complex object lifecycles (e.g., order status). |
| Deployment | Where does it run? | Planning infrastructure and server architecture. |
Common Pitfalls for Beginners ⚠️
Even experienced practitioners make mistakes when creating models. Being aware of common errors can save significant time during the development phase.
1. Over-Modeling
Creating diagrams that are too detailed for the current phase of the project. Not every class needs to be drawn in the initial design phase. Focus on high-level architecture first, then refine.
2. Inconsistent Notation
Using different symbols for the same concept within the same diagram set. This breaks the standard and confuses readers. Stick to the official UML specifications.
3. Ignoring Relationships
Focusing solely on classes or actors without defining how they interact. Relationships are often where the logic of the system resides. Ensure cardinality (e.g., 1-to-Many) is marked clearly.
4. Mixing Structural and Behavioral
Putting activity flows inside a class diagram or showing static classes inside a sequence diagram. Keep structural diagrams for structure and behavioral diagrams for flow to maintain clarity.
5. Lack of Context
Creating diagrams without a defined scope. A diagram should always have a boundary or a system context to show what is included and what is external.
Building Your First UML Model 🛠️
Once you understand the concepts, the next step is application. Follow this logical workflow to start modeling without getting overwhelmed.
Step 1: Define the Scope
Identify the boundaries of the system. What is inside the box and what is outside? Define the actors involved. This prevents scope creep during the modeling process.
Step 2: Create the Use Cases
Start with the user’s perspective. Draw the Use Case Diagram to ensure you understand what the system needs to do. This aligns the team on functional requirements before technical details are discussed.
Step 3: Design the Core Classes
Based on the use cases, identify the nouns that will become classes. Define their attributes and methods. Draw the Class Diagram to visualize the data structure.
Step 4: Map the Interactions
For complex functions, use Sequence Diagrams. Trace the path of a message from the actor through the system components. This reveals hidden dependencies.
Step 5: Review and Refine
Walk through the diagrams with stakeholders. Ask if the flow makes sense. Check if the relationships accurately reflect the business rules. Iterate based on feedback.
Advanced Concepts for Growth 🚀
As you become comfortable with the basics, you can explore more advanced features of UML to handle complex scenarios.
1. Stereotypes
These are extensions to the UML notation that allow you to define custom types. For example, you might create a stereotype to denote a specific design pattern or a specific database type.
2. Profiles
A profile is a way to customize UML for a specific domain. It defines a set of stereotypes, tagged values, and constraints tailored to a specific industry or technology stack.
3. Constraints
Used to add specific rules that the model must follow. These are usually written inside curly braces, such as {unique ID} or {must be positive}.
Conclusion 🏁
Mastery of UML comes with practice and patience. It is a tool for thinking, not just for drawing. By using this checklist, you have established a strong foundation in the core concepts of Unified Modeling Language. Whether you are designing a simple application or a distributed enterprise system, these diagrams provide the clarity needed to succeed.
Remember, the goal of modeling is to reduce ambiguity. If a diagram can be interpreted in multiple ways, it needs refinement. Focus on communication, consistency, and clarity. With these principles in mind, your technical documentation will be robust, scalable, and effective.
Continue to apply these concepts to your projects. Start small, expand gradually, and always prioritize the needs of the team and the stakeholders over the complexity of the diagram itself.

? The Quick Guide")