


Understanding how different parts of a software system communicate is essential for building robust applications. A sequence diagram is a specific type of interaction diagram that shows how objects operate one another and when. This visual tool captures the dynamic behavior of a system, focusing on the order of interactions over time. For beginners entering the world of software modeling, mastering this notation provides a clear roadmap of system logic. This guide breaks down the process into manageable steps, ensuring you can construct these diagrams with confidence and clarity.
What is a Sequence Diagram? 📐
A sequence diagram is a part of the Unified Modeling Language (UML) family. It depicts objects interacting in the order that messages are sent. Unlike class diagrams which focus on static structure, sequence diagrams focus on dynamic behavior. They represent a scenario where a user or an external system triggers an action, and various internal components respond to that action.
The primary goal is to clarify the flow of control and data. By laying out interactions vertically, you can see the chronological sequence of events. This makes it easier to identify bottlenecks, missing logic, or circular dependencies. It serves as a communication bridge between developers, stakeholders, and testers. When everyone understands the flow, the risk of misinterpretation during development decreases significantly.
Core Components and Visual Grammar 🧩
Before drawing, you must understand the vocabulary of the notation. Every element has a specific meaning. Using the correct symbols ensures that anyone reading the diagram understands the intended behavior. Below is a breakdown of the fundamental building blocks.
| Element | Visual Representation | Purpose |
|---|---|---|
| Participant | Rectangular box with text | Represents an object, class, user, or external system. |
| Lifeline | Dashed vertical line | Shows the existence of the participant over time. |
| Message | Horizontal arrow | Indicates communication from one participant to another. |
| Activation Bar | Thin rectangle on the lifeline | Shows when an object is actively performing an operation. |
| Return Message | Dashed arrow | Indicates a response or return value to the caller. |
Each component plays a critical role. The participant is the actor in the scene. The lifeline represents their timeline. Messages drive the action forward. Activation bars show when the system is busy. Understanding these distinct parts allows you to construct complex scenarios without confusion.
Understanding Participants and Lifelines 🏃
Participants are the objects or systems involved in the interaction. They can be internal software components, database servers, user interfaces, or external APIs. In the diagram, they are placed horizontally across the top. The order of placement is often determined by the flow of control or logical grouping.
Once placed, a lifeline extends downwards from each participant. This dashed line represents the passage of time. It indicates that the participant is alive and available to receive messages during that period. If a lifeline stops, it implies the object has been destroyed or the interaction has ended for that specific scenario.
When defining participants, keep names descriptive. Avoid generic terms like Object1 or System. Instead, use specific names like User, OrderProcessor, or DatabaseConnection. This improves readability and makes the diagram self-explanatory. Clarity in naming reduces the need for additional documentation.
Decoding Messages and Arrows 📤
Messages are the lines that connect lifelines. They represent the transfer of information or the invocation of a method. The style of the arrow indicates the type of communication. Understanding these distinctions is vital for accurate modeling.
| Arrow Style | Symbol | Meaning |
|---|---|---|
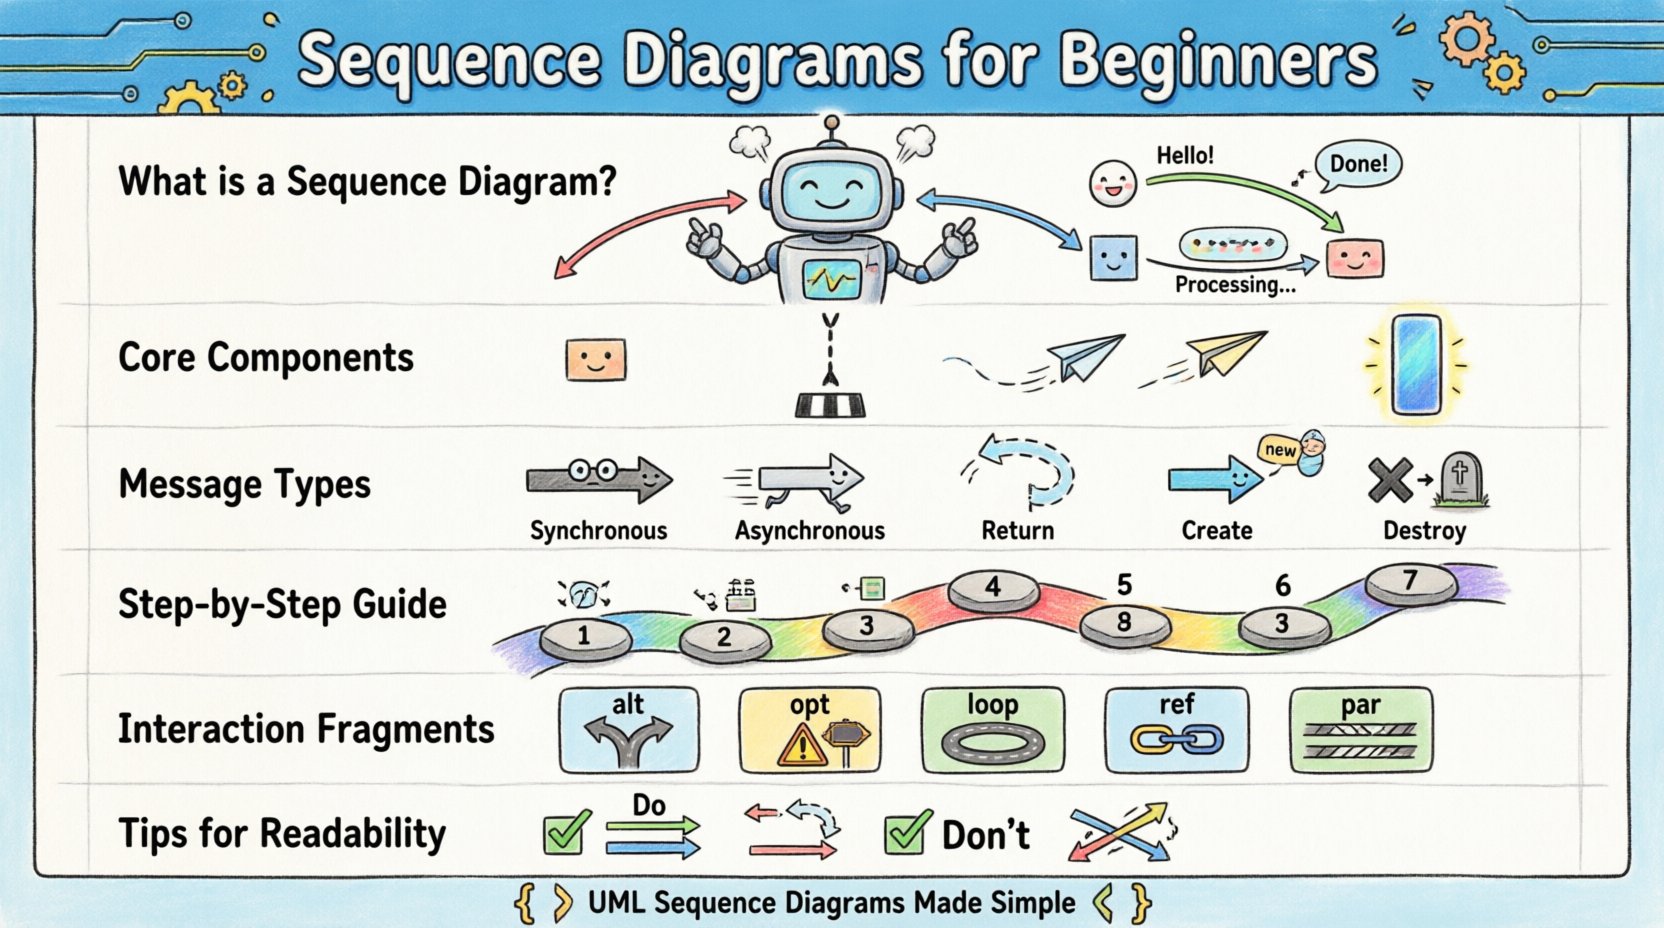
| Synchronous | Solid line with filled arrowhead | Caller waits for the receiver to finish before continuing. |
| Asynchronous | Solid line with open arrowhead | Caller sends message and continues immediately. |
| Return | Dashed line with open arrowhead | Response sent back to the caller. |
| Create | Line with dashed arrowhead and "new" label | Indicates the creation of a new object. |
| Destroy | Line with "X" at the end of lifeline | Indicates the termination of an object. |
Synchronous messages are common when one step must complete before the next begins. Asynchronous messages allow for parallel processing or fire-and-forget scenarios. Return messages are often implicit but should be drawn if a specific value or status is critical to the flow. Creating and destroying messages help define the lifecycle of temporary objects.
Constructing a Diagram: A Step-by-Step Walkthrough 🚶
Building a sequence diagram requires a logical approach. You do not simply draw lines; you map out a story. Follow these steps to ensure accuracy and completeness.
- Define the Goal: Start with a specific use case. What action is the user trying to perform? What is the expected outcome?
- Identify Participants: List all objects involved in this specific scenario. Place them at the top of the canvas.
- Draw the Trigger: Start with the first message. Usually, this comes from an external actor initiating the process.
- Add Activation Bars: Whenever an object receives a message and processes it, draw a small rectangle on its lifeline.
- Sequence the Messages: Draw arrows from top to bottom. Ensure the vertical order reflects the timeline of events.
- Include Responses: Add return messages where data is sent back. This completes the transaction loop.
- Review for Flow: Check if every message has a destination. Ensure no lifelines are left hanging unnecessarily.
By following this structured approach, you avoid common pitfalls like crossing lines or ambiguous logic. The diagram should read naturally from top to bottom, mimicking the passage of time.
Handling Complex Logic with Interaction Fragments 🔄
Real-world scenarios are rarely linear. Decisions, loops, and optional steps occur frequently. UML provides interaction fragments to handle these variations. These fragments are enclosed in a rectangular box with a label indicating the type of logic.
- Alternative (alt): Represents conditional logic. The diagram splits into different paths based on a condition. For example, if a password is correct, proceed to login. If incorrect, show an error message.
- Optional (opt): Indicates a block that may or may not occur. This is used for non-critical steps or optional features.
- Loop (loop): Represents iterative behavior. This is used when a set of messages repeats until a condition is met, such as processing a list of items.
- Reference (ref): Links to another sequence diagram. This helps manage complexity by breaking large diagrams into smaller, manageable sub-diagrams.
- Parallel (par): Shows multiple threads of activity happening at the same time. This is useful for systems that handle concurrent requests.
Using these fragments correctly keeps the diagram organized. Without them, you might end up drawing multiple branches that look like a spiderweb. Grouping logic into frames makes the intent clear and the structure maintainable.
Guidelines for Maintaining Readability 📏
A diagram that is too complex defeats its purpose. The goal is communication, not just documentation. Adhere to these guidelines to keep your diagrams clean and understandable.
- Limit Scope: Focus on one specific use case per diagram. Do not try to capture the entire system in a single view.
- Keep Names Short: Use concise labels for messages. Long sentences make arrows hard to read. Use verbs like validate, save, or fetch.
- Avoid Crossing Lines: Arrange participants horizontally to minimize line intersections. Use layers or sub-diagrams if necessary.
- Use Consistent Notation: Stick to standard UML symbols. Do not invent custom shapes unless absolutely necessary.
- Label Conditions: Always label the guard conditions in alternative and loop fragments. This tells the reader exactly what triggers the change in flow.
- Whitespace is Key: Leave space between messages. Crowding makes the timeline difficult to follow.
Readability is subjective but follows universal principles of visual design. If a stakeholder cannot understand the flow within two minutes, the diagram needs simplification.
Common Mistakes and How to Fix Them ❌
Even experienced modelers make errors. Recognizing these common mistakes helps you refine your work.
- Mixing Levels of Detail: Do not mix high-level business logic with low-level database queries in the same diagram. Keep the abstraction level consistent.
- Ignoring Return Messages: While optional, omitting return messages can hide critical failures or data retrieval steps. Include them when the return value affects the next step.
- Unclear Participants: If a participant is not defined, the interaction is ambiguous. Ensure every box represents a known entity in the system architecture.
- Too Many Arrows: If you have more than ten messages between two objects, consider creating a sub-diagram or a reference. It indicates a complex internal process.
- Static Thinking: Remember that sequence diagrams are dynamic. Do not draw relationships that do not involve time-based messages.
Fixing these issues often involves stepping back and reviewing the scenario. Ask yourself if every line adds value to the understanding of the system. If not, remove it.
Integrating Diagrams into the Development Lifecycle 🔄
Sequence diagrams are not just for documentation; they are tools for development. They fit into the early stages of the design process. Before writing code, developers can use these diagrams to validate logic.
- Planning Phase: Use diagrams to discuss requirements with stakeholders. Visuals often clarify ambiguities that text descriptions miss.
- Design Phase: Developers can translate the diagram directly into class structures and method signatures. This ensures the code matches the design intent.
- Testing Phase: Testers can use the diagram to create test cases. Each message path represents a potential test scenario.
- Maintenance Phase: When modifying existing code, update the diagram. This keeps the documentation synchronized with the actual system behavior.
This integration ensures that the visual model remains a living artifact. It evolves with the software, providing a consistent reference point throughout the project lifecycle. By treating diagrams as active tools rather than static artifacts, teams improve collaboration and reduce defects.
Mastering the sequence diagram takes practice. It requires attention to detail and a clear understanding of system interactions. However, the investment pays off in clearer communication and better software architecture. Start with simple scenarios and gradually add complexity as you become comfortable with the notation. With patience and practice, you will be able to visualize complex interactions with ease.

