


Understanding how software objects behave over time is one of the most critical skills in system design. As a junior developer, you often focus on writing code that works for the immediate task. However, the long-term stability of an application depends heavily on how objects transition between different conditions. This is where State Machine Diagrams come into play. These diagrams provide a clear visual representation of an object’s life, from its creation to its destruction.
In this guide, we will explore the mechanics of UML State Machine Diagrams. We will look at how to define states, manage transitions, and handle events. By the end of this article, you will have a solid grasp of how to model complex logic without writing spaghetti code. This approach helps prevent bugs and makes your system easier to maintain.
🧩 Why Object Lifecycles Matter
Every object in your application has a story. It starts, it changes, it reacts to inputs, and eventually, it ends. Without a clear map of this journey, logic becomes difficult to trace. Consider a banking transaction. The money cannot simply appear; it must move from Pending to Processing to Completed or Failed. If the system allows a Completed transaction to suddenly revert to Pending without a specific reason, data integrity is compromised.
State Machine Diagrams solve this problem by enforcing rules on how an object can change. They ensure that:
- Only valid transitions occur.
- All possible states are accounted for.
- Actions are triggered at the correct moments.
- Unexpected states are impossible to reach.
For junior developers, this discipline is invaluable. It shifts your focus from implementation details to architectural logic. It forces you to think about edge cases before you write a single line of code.
🛠️ Core Components of a State Machine
A state machine diagram is composed of specific elements. Each element serves a distinct purpose in defining the behavior of the system. Understanding these building blocks is the first step toward creating accurate diagrams.
1. States
A state represents a condition or situation during the life of an object. In a diagram, a state is usually depicted as a rounded rectangle. Inside the box, you write the name of the condition. For example, a user object might be in a Logged In state or a Logged Out state. States are not just empty placeholders; they often contain behavior.
There are two main types of activities within a state:
- Entry Action: What happens immediately when the state is entered.
- Exit Action: What happens immediately when the state is left.
Additionally, some states allow for continuous activity while the object remains in that condition. This is known as an Do Activity. For instance, a Downloading state might have an entry action to start the download and an exit action to save the file, but the download process itself runs continuously while in the state.
2. Transitions
Transitions define how an object moves from one state to another. They are represented by arrows connecting the states. A transition implies that the object has changed its status. This change is triggered by an event.
Key aspects of transitions include:
- Source State: Where the transition starts.
- Target State: Where the transition ends.
- Trigger Event: The signal that causes the move (e.g., a button click, a timer expiry).
- Guard Condition: An optional boolean expression that must be true for the transition to happen.
- Action: Code or logic executed during the transition.
3. Events
An event is something that happens at a specific point in time. It triggers a transition. Events can be:
- Signal Events: Messages from external sources.
- Call Events: Method invocations.
- Time Events: A specific duration or clock time.
- Change Events: A condition changing to true or false.
4. Initial and Final States
Every state machine needs a starting point and an ending point.
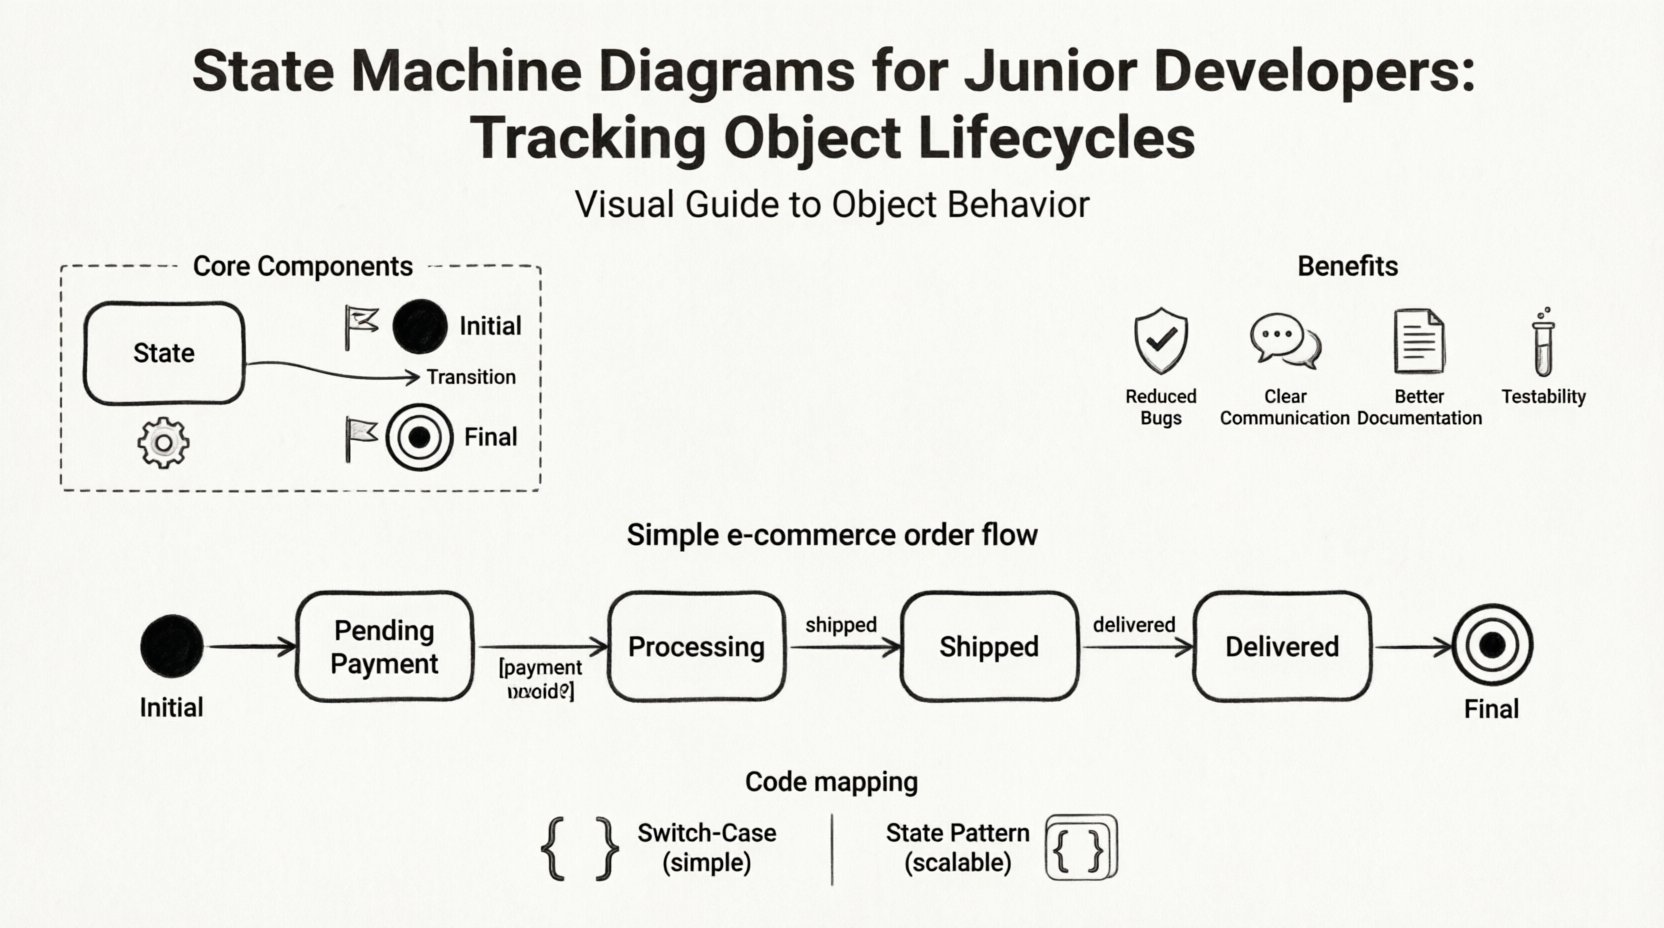
- Initial State: Represented by a solid black circle. It indicates the first state the object enters upon creation.
- Final State: Represented by a black circle with a surrounding ring. It indicates that the object has completed its lifecycle or reached a terminal condition.
📊 Visual Notation Guide
To read and write these diagrams effectively, you must understand the standard symbols. The following table summarizes the most common notations used in UML State Machine Diagrams.
| Symbol | Name | Description |
|---|---|---|
| ● | Initial State | Start of the diagram. No incoming transitions. |
| ⒪ | Final State | End of the diagram. Usually no outgoing transitions. |
| ⬜ | State | Rounded rectangle. Represents a condition. |
| ➡️ | Transition | Arrow connecting two states. |
| [Condition] | Guard | Brackets around text on a transition line. |
| event / action | Trigger / Effect | Label on the transition arrow. |
Using these symbols consistently ensures that anyone reading your diagram understands the logic immediately. Consistency reduces ambiguity in team environments.
📦 Practical Example: E-commerce Order Processing
Let us apply these concepts to a real-world scenario. Imagine an order management system. An order goes through several phases from the moment a customer clicks buy to the moment the package is delivered.
Here is how we map this lifecycle:
- Initial State: The order is created.
- State: Pending Payment: The system waits for the customer to pay.
- Transition: Payment Received: Moves to Processing.
- State: Processing: Inventory is reserved and the item is packed.
- Transition: Shipment Created: Moves to Shipped.
- State: Shipped: The item is with the courier.
- Transition: Delivery Confirmation: Moves to Delivered.
- State: Delivered: The final state. The order is complete.
However, things do not always go smoothly. We must account for failures. What if payment fails? We need a transition from Pending Payment to Cancelled. What if the item is out of stock while processing? We might need to move to Backordered.
This complexity is why a visual diagram is essential. It forces you to ask: What happens if the user cancels during shipping? What happens if the courier fails? By mapping these paths, you prevent logic gaps.
🔐 Practical Example: User Authentication
Another common use case is handling user sessions. Authentication logic is often stateful. Let us look at a simplified login flow.
- Start: User has no active session.
- State: Idle: The system is waiting for input.
- Transition: Login Attempt: User enters credentials.
- State: Verifying: The system checks the database.
- Transition: Success: Moves to Authenticated.
- Transition: Failure: Moves to Locked or stays in Idle.
- State: Authenticated: User has access. Session is active.
- Transition: Logout: Moves to Idle.
- Transition: Timeout: If no activity for 30 minutes, moves to Idle.
Notice the Timeout event. This is a time-based trigger. In code, this might be a background timer. In the diagram, it is simply an event label on the transition arrow. This abstraction helps you separate the timing logic from the state logic.
⚠️ Common Pitfalls to Avoid
When creating state diagrams, it is easy to make mistakes. These errors can lead to confusing documentation and difficult code. Be aware of the following common issues.
- Spaghetti States: Too many crossing arrows make the diagram unreadable. Try to group related states.
- Missing Transitions: If a state has no outgoing transition for a specific event, the system will hang. Ensure every state handles unexpected inputs gracefully.
- Over-complicating: Do not try to model every single detail of the UI. Focus on the core object logic. Keep the diagram high-level enough to be understood.
- Ignoring Final States: Ensure you define how an object dies or is archived. An object that never reaches a final state might leak memory or hold resources indefinitely.
- Concurrent States: Some objects exist in multiple states at once. If you do not understand composite states, you might model them incorrectly. Use nested boxes for this.
💻 Mapping Diagrams to Code
Once the diagram is complete, how do you implement it? There are two main approaches: the Switch-Case method and the State Pattern.
The Switch-Case Method
This is the most common approach for simple systems. You maintain a variable that holds the current state. In your logic, you use a switch statement to handle actions based on that variable.
- Pros: Simple to understand, no extra classes needed.
- Cons: Becomes hard to maintain as the number of states grows. Logic can become scattered across multiple methods.
The State Pattern
This is a design pattern where each state is represented by a class. The object delegates behavior to the current state object.
- Pros: Clean separation of concerns. Adding a new state requires a new class, not modifying existing code.
- Cons: More classes to manage. Can be overkill for very simple scenarios.
Regardless of the method, the diagram acts as the contract. If the code deviates from the diagram, the diagram needs updating. They must remain in sync.
🔄 Maintenance and Evolution
Software is never static. Requirements change. New features are added. Your state machine diagram must evolve with the code. When a new feature is requested, ask yourself: Does this create a new state? Does it alter an existing transition?
Refactoring is easier when you have a diagram. If you need to change how an object behaves, you can update the diagram first. This acts as a safety net. You can verify the logic visually before touching the code. This reduces the risk of introducing regressions.
📈 Benefits of State Machine Diagrams
Why invest time in these diagrams? The benefits are tangible and measurable.
- Reduced Bugs: Visualizing logic helps catch impossible paths before coding begins.
- Clear Communication: Stakeholders and other developers can understand the flow without reading code.
- Better Documentation: The diagram serves as living documentation that is always up to date with the design intent.
- Testability: It is easy to write unit tests for every state and transition. You know exactly what to test.
- Performance Optimization: You can identify states that are too complex and break them down.
🚀 Final Thoughts
State Machine Diagrams are not just academic exercises. They are practical tools that improve the quality of your software. For junior developers, learning to draw these diagrams is a career-defining skill. It demonstrates a maturity in thinking about system design that goes beyond syntax.
Start small. Pick a simple object in your current project. Draw its lifecycle. Identify the states and transitions. Then, compare your drawing to the actual code. You will likely find discrepancies that need fixing.
By mastering the visual language of state machines, you gain control over complexity. You ensure that your objects behave predictably, even in the most chaotic environments. This is the foundation of robust software architecture.
Remember, the goal is not to create a perfect diagram immediately. The goal is to create a useful map. Iterate on it. Refine it. Let it guide your development process. With practice, this workflow will become second nature.

