


Designing robust software systems requires more than just writing code. It demands a clear vision of how parts interact and where they reside. 🧩 When engineers plan for growth, they rely on specific visual models to communicate structure and infrastructure. This guide explores the critical role of Component and Deployment Diagrams in UML. These tools help teams visualize static structure and runtime topology. By mastering these representations, architects can ensure systems remain stable under load. 📈
Why Visual Modeling Matters for Architecture 🧭
Before diving into specific diagram types, it is essential to understand why visualization is non-negotiable in complex projects. Text alone often fails to capture the nuances of dependencies and physical distribution. Visual models bridge the gap between abstract requirements and concrete implementation.
- Clarity: Stakeholders can see the system layout without reading thousands of lines of code. 👁️
- Communication: Developers and operations teams share a common language. 🗣️
- Scalability Planning: Identifying bottlenecks before deployment saves resources. 📉
- Maintainability: Future changes are easier to map when the structure is documented. 🛠️
UML (Unified Modeling Language) provides standard notation for these diagrams. While there are many diagram types, the Component and Deployment diagrams are specifically designed for high-level architecture and infrastructure planning. 🏛️
Understanding Component Diagrams 🧩
A Component Diagram represents the physical or logical components of a system. It focuses on the structure of the software itself rather than the code flow. Think of this as the blueprint for the building blocks that make up your application. 🧱
Core Elements of a Component Diagram
To construct a meaningful diagram, you must understand the fundamental symbols:
- Component: A modular part of the system. It encapsulates behavior and data. Examples include a database module, a user authentication service, or a payment processor. 🟦
- Interface: A contract that defines how a component interacts with others. It specifies the methods available without revealing internal logic. 🔌
- Port: A designated point on a component where interfaces are provided or required. It acts like a socket for connection. 🔌
- Dependency: A relationship where one component relies on another to function. If the dependency breaks, the dependent component may fail. 🔗
- Realization: A relationship where one component implements an interface provided by another. This is common in object-oriented design. 📄
Designing for Scalability with Components
When planning for scale, component diagrams help identify where to add redundancy or separate concerns. High coupling between components can create bottlenecks. Low coupling allows teams to scale specific parts independently.
- Decoupling: Use interfaces to separate implementation from usage. This allows swapping implementations without changing dependent components. 🔄
- Modularity: Break large systems into smaller, manageable components. This reduces complexity and improves testability. 🧪
- Layering: Organize components into layers (e.g., presentation, business logic, data access). This ensures clear separation of duties. 🏢
Understanding Deployment Diagrams 🖥️
While Component Diagrams show what the software is made of, Deployment Diagrams show where it runs. This diagram type maps software artifacts to physical hardware nodes. It is crucial for DevOps and infrastructure teams. 🚀
Core Elements of a Deployment Diagram
The vocabulary here shifts from logical structures to physical resources:
- Node: A computational resource. This could be a physical server, a virtual machine, a container, or a mobile device. 💻
- Artifact: A physical representation of a software component. This includes executables, libraries, configuration files, or database scripts. 📦
- Communication Path: The network connection between nodes. It defines the protocol (e.g., HTTP, TCP/IP, gRPC). 🌐
- Dependency: Indicates that an artifact deployed on one node requires another artifact on a different node. 🔄
- Device: Specific hardware with limited processing power, such as IoT sensors or smartphones. 📱
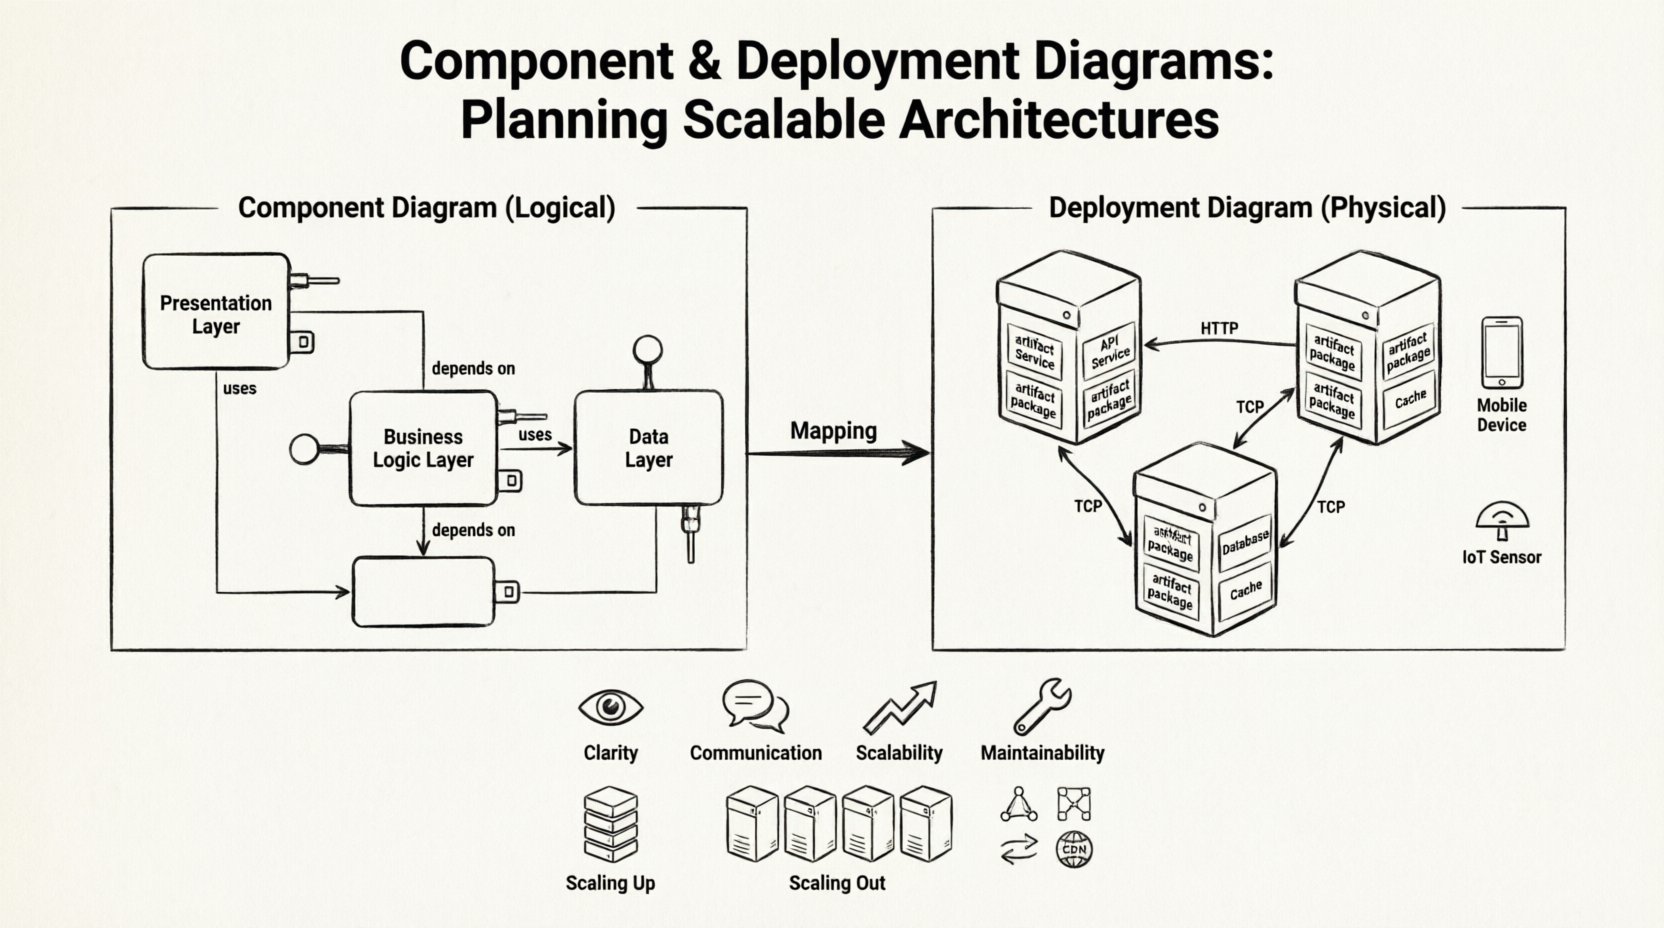
Mapping Components to Deployment
The connection between Component and Deployment diagrams is vital. A component diagram defines the logical pieces, while the deployment diagram places them on hardware. This mapping reveals where the system lives.
For example, a PaymentService component might be deployed as a PaymentService.jar artifact on a Web Server Node. If the system scales, this artifact might be replicated across multiple nodes. 🔄
Planning for Scalable System Architectures 🚀
Scalability is the ability of a system to handle increased load. Both diagram types play a role in this planning process. They help architects decide whether to scale vertically or horizontally.
Vertical vs. Horizontal Scaling
Understanding the difference is critical for resource allocation.
- Vertical Scaling (Scaling Up): Adding more power (CPU, RAM) to an existing node. This is often simpler but has hardware limits. 💪
- Horizontal Scaling (Scaling Out): Adding more nodes to the system. This requires load balancing and state management strategies. 🏗️
Deployment diagrams are particularly useful for visualizing horizontal scaling. You can draw multiple nodes running the same artifact to show redundancy.
Key Architectural Patterns
Certain patterns emerge frequently in scalable designs. These patterns should be reflected in your diagrams.
- Load Balancing: A node that distributes traffic across multiple backend servers. This prevents any single node from becoming a bottleneck. ⚖️
- Microservices: Small, independent services that communicate over a network. Component diagrams show the services; deployment diagrams show the containers or VMs hosting them. 🧩
- Replication: Copying data or services across multiple nodes for reliability. Deployment diagrams show the data paths between replicas. 📋
- CDN (Content Delivery Network): Using distributed nodes to serve static content closer to users. This reduces latency. 🌍
Comparing Component and Deployment Diagrams 📊
It is easy to confuse these two diagram types. They serve different purposes within the same modeling process. Use the table below to distinguish them clearly.
| Feature | Component Diagram | Deployment Diagram |
|---|---|---|
| Focus | Logical structure and software organization | Physical topology and infrastructure |
| Primary Actors | Developers, Architects | DevOps, System Administrators |
| Key Elements | Interfaces, Ports, Dependencies | Nodes, Artifacts, Communication Paths |
| Time Context | Static structure (Design Time) | Runtime environment (Run Time) |
| Goal | How the system is built | Where the system runs |
Step-by-Step Guide to Creating These Diagrams 📝
Creating effective diagrams requires a disciplined approach. Follow these steps to ensure your architecture is documented accurately.
Step 1: Define the Scope
Start by identifying the boundaries of the system. What is included inside the diagram, and what is external? External systems are often represented as black boxes. This keeps the diagram focused. 🎯
Step 2: Identify Components
List all logical modules. Group them by function. For a scalable system, ensure each component has a single responsibility. This makes future changes easier. 🧭
- Extract the core business logic.
- Isolate data access layers.
- Define user interface modules.
Step 3: Define Interfaces and Contracts
Specify how components talk to each other. Avoid tight coupling. Use clear interface definitions. This ensures that components can be replaced or updated without breaking the whole system. 🤝
Step 4: Map to Infrastructure
Now, switch to the Deployment view. Identify the hardware or cloud resources needed. Decide if services will run on bare metal, VMs, or containers. Consider network security and latency. 🌐
- Assign artifacts to nodes.
- Define network protocols.
- Plan for failover paths.
Step 5: Validate Scalability
Review the diagram with a critical eye. Can the system handle a 10x increase in users? Are there single points of failure? Are database connections pooled? Adjust the design if necessary. 🔍
Common Pitfalls to Avoid ⚠️
Even experienced architects make mistakes when modeling. Be aware of these common issues.
1. Over-Complication
Do not try to model every single class in a component diagram. Keep it high-level. If the diagram is too complex, it becomes unreadable. 🚫
2. Ignoring Network Latency
In deployment diagrams, do not assume all nodes are equally fast. Network distance matters. Map nodes geographically if your users are distributed globally. 🌍
3. Static vs. Dynamic Confusion
Component diagrams show static structure. They do not show how data flows at runtime. Do not use them to explain process logic. Use sequence diagrams for flow. 🔄
4. Outdated Documentation
Models become stale quickly. Ensure diagrams are updated whenever the architecture changes. An outdated diagram is worse than no diagram. 🕒
5. Missing External Dependencies
Often, systems rely on third-party APIs or legacy databases. Ensure these are shown in the deployment view. They represent potential failure points. 🔌
Best Practices for Maintenance 🛠️
Once the diagrams are created, they need care. Here is how to keep them relevant.
- Version Control: Store diagrams in the same repository as the code. This ensures they evolve together. 📂
- Automation: Use tools that can generate diagrams from code or infrastructure-as-code definitions. This reduces manual errors. 🤖
- Review Cycles: Include diagram reviews in the design phase of sprints. Check for consistency. 🗓️
- Standardization: Adopt a naming convention for nodes and components. This makes reading the diagram easier for new team members. 📏
Integrating with CI/CD Pipelines 🔄
Modern software delivery involves Continuous Integration and Continuous Deployment. Diagrams should inform these pipelines.
- Environment Mapping: The deployment diagram should reflect the CI/CD environments (Dev, Staging, Production). 🏗️
- Security Zones: Clearly mark network security boundaries. This helps configure firewall rules in the pipeline. 🔒
- Rollback Strategies: If a deployment fails, the diagram helps identify which components need to be reverted. 🔄
Conclusion 🏁
Building scalable systems is a complex endeavor. It requires careful planning and clear communication. Component and Deployment Diagrams are not just documentation; they are planning tools. They allow teams to visualize the future state of the system before writing a single line of production code. By adhering to best practices and avoiding common pitfalls, architects can ensure their systems are robust, maintainable, and ready for growth. 🌟
Remember, the goal is not perfection in the drawing, but clarity in the understanding. Keep the models simple, keep the interfaces clean, and always align the logical components with the physical reality of your infrastructure. This alignment is the foundation of successful system architecture. 🏗️

