


Technical interviews often test more than just syntax knowledge. They assess your ability to visualize systems, communicate complex ideas, and design robust architectures. This is where Unified Modeling Language (UML) becomes a critical asset. 🛠️ Using UML diagrams correctly demonstrates clarity of thought and structural understanding.
Many candidates struggle to translate abstract requirements into concrete visual models. This guide provides a practical framework for leveraging UML in interview settings without relying on specific software tools. You will learn how to sketch effective diagrams that convey your architectural decisions clearly.
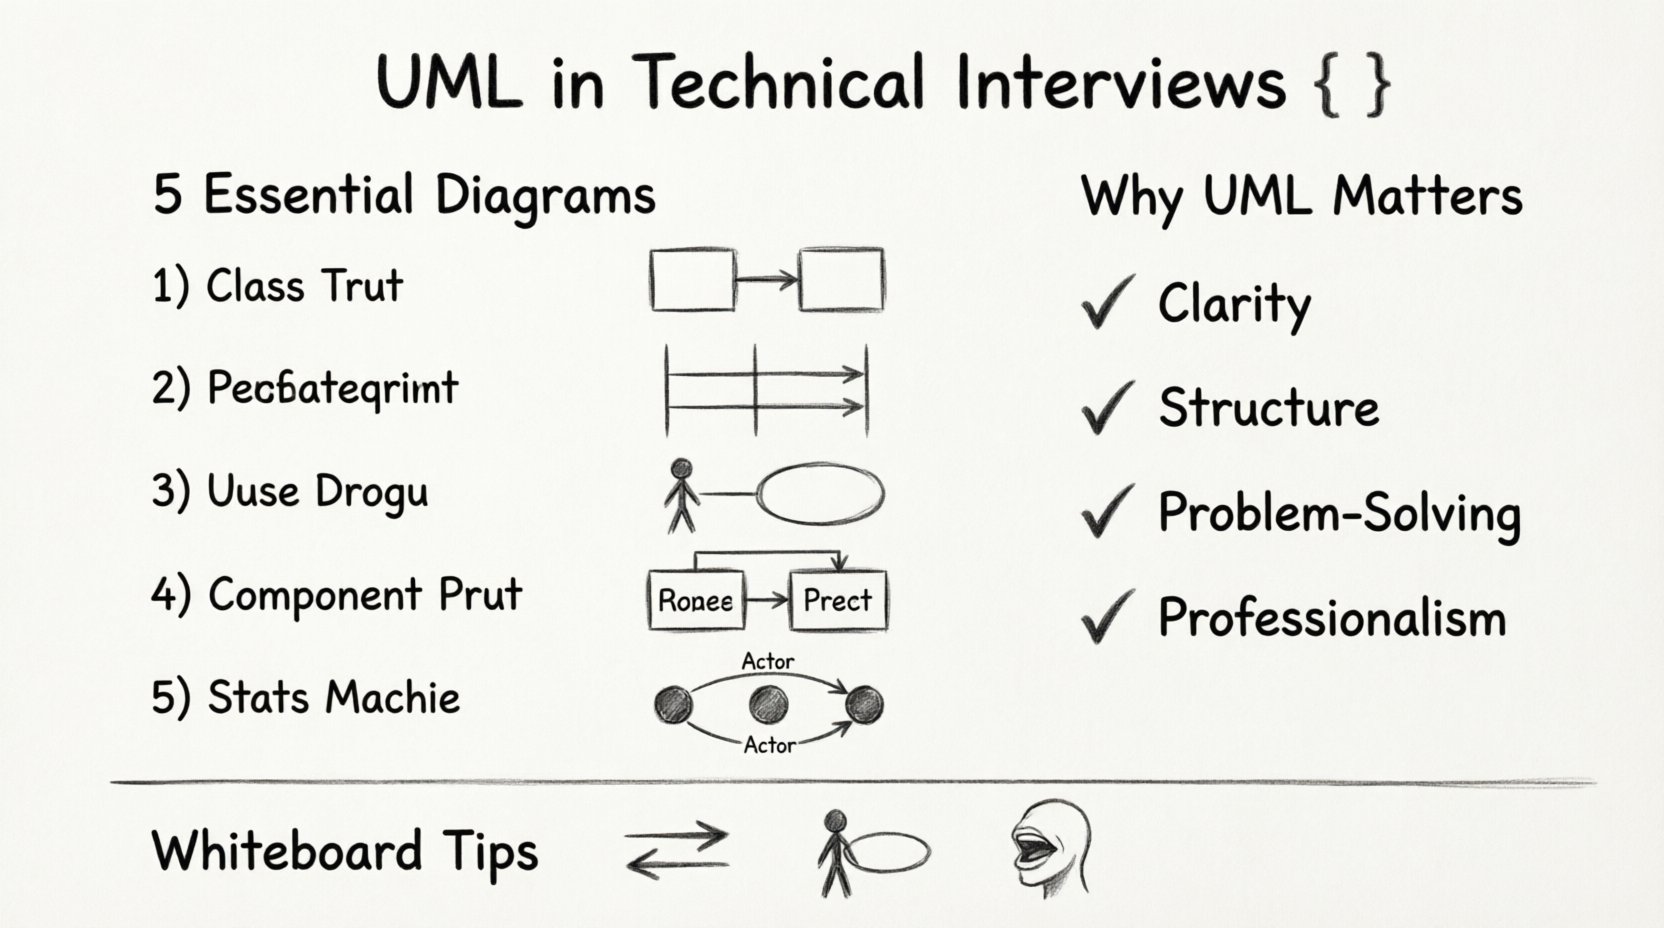
Why UML Matters in Technical Interviews 📊
Recruiters and engineering managers look for signals of seniority and system thinking. Verbal descriptions can become muddled under pressure. Visual aids anchor the conversation. When you draw a diagram, you force yourself to define relationships, boundaries, and data flows explicitly.
Here are the core benefits of using UML in an interview context:
- Clarity of Communication: Visuals reduce ambiguity. A sequence diagram shows timing better than text alone.
- Structural Validation: Drawing class relationships helps you spot circular dependencies early.
- Problem Solving: Breaking a large problem into components on a whiteboard makes it manageable.
- Professionalism: It shows you follow industry-standard modeling practices.
Remember, the goal is not perfection. It is to facilitate a discussion. A rough sketch that leads to a productive dialogue is more valuable than a pristine image that halts conversation.
Essential UML Diagrams for Interviews 📝
You do not need to master all 14 UML diagram types. In an interview setting, a focused selection covers 90% of use cases. The following diagrams are the most frequently requested and useful.
1. Class Diagrams (Structure) 🏗️
Class diagrams define the static structure of a system. They show classes, interfaces, attributes, and methods. Crucially, they depict relationships like inheritance, association, aggregation, and composition.
When to use:
- Discussing object-oriented design patterns.
- Defining data models and entity relationships.
- Explaining how components interact through interfaces.
Key Symbols:
- Rectangle: Represents a class.
- Line with open arrow: Indicates inheritance (extends).
- Line with diamond: Aggregation (weak relationship).
- Line with filled diamond: Composition (strong relationship).
- Dashed line: Implementation (interface).
2. Sequence Diagrams (Behavior) 🔄
Sequence diagrams illustrate how objects interact over time. They are essential for detailing API flows, user actions, and backend processing steps. Time flows from top to bottom.
When to use:
- Mapping out user login flows.
- Explaining request-response cycles.
- Describing asynchronous events or callbacks.
Key Symbols:
- Rectangle: Represents a participant (actor, object, system).
- Vertical Line: Represents the lifeline of the participant.
- Arrow: Represents a message or method call.
- Dashed Arrow: Represents a return message.
- Rectangle Box: Represents an activation bar (time the object is active).
3. Use Case Diagrams (Requirements) 📋
Use case diagrams provide a high-level view of system functionality from the perspective of an external actor. They define what the system does, not how it does it.
When to use:
- Defining scope and boundaries.
- Clarifying stakeholder requirements.
- Identifying actors (users, external systems).
Key Symbols:
- Stick Figure: Represents an actor.
- Ellipse: Represents a use case.
- Line: Connects actors to use cases.
- Arrow (<
> or < Shows dependency between use cases.>):
4. Component Diagrams (Architecture) 🧩
Component diagrams show the organization and dependencies between software components. They are higher level than class diagrams and lower level than architecture diagrams.
When to use:
- Describing microservices architecture.
- Showing deployment of modules.
- Clarifying interface contracts between services.
5. State Machine Diagrams (Logic) ⚙️
State diagrams describe the behavior of a single object throughout its lifecycle. They are useful for complex workflows where state transitions matter.
When to use:
- Order processing logic (pending, shipped, delivered).
- Payment status flows.
- User session management.
Comparison of Diagram Types ⚖️
Choosing the right diagram is half the battle. Use this table to select the appropriate model for your interview scenario.
| Diagram Type | Focus | Best Used For | Complexity |
|---|---|---|---|
| Class Diagram | Static Structure | Data models, OOP design | Medium |
| Sequence Diagram | Dynamic Interaction | API flows, User journeys | High |
| Use Case Diagram | Functional Requirements | Scope definition, Actors | Low |
| Component Diagram | System Organization | Microservices, Modules | Medium |
| State Machine | Object Lifecycle | Workflow logic, States | Medium |
How to Sketch Diagrams Without Software 🖍️
Interviews often require whiteboarding. You cannot rely on auto-complete or snapping tools. You must rely on hand-drawn clarity. Here is a strategy for effective manual diagramming.
Preparation Phase
- Standardize Symbols: Agree on a notation style early. If you draw a rectangle for a class, do not switch to a circle halfway through.
- Label Everything: A blank arrow is confusing. Label it with the method name or data payload.
- Use Space Wisely: Leave room for annotations. Do not cram elements too tightly.
Execution Phase
- Start with the Box: Draw the actors or top-level components first. Establish the boundaries.
- Draw the Flow: Connect components with arrows. Ensure directionality is clear.
- Annotate: Add notes about constraints, protocols, or data formats.
- Refine: If a line looks messy, redraw it cleanly nearby. Do not erase heavily, as it distracts the interviewer.
Common Hand-Drawn Pitfalls
- Inconsistent Line Width: Keep lines steady. Thick lines for boundaries, thin for relationships.
- Messy Text: Write legibly. If you misspell a class name, circle it and rewrite it neatly.
- Missing Arrows: Always indicate direction. An undirected line implies a bidirectional link, which might not be intended.
Deep Dive: Sequence Diagram Strategy 🚀
Sequence diagrams are the most common request in system design interviews. They require precision. A mistake in ordering can imply a race condition or a deadlock.
Step-by-Step Construction:
- Identify Actors: Who initiates the request? (User, Mobile App, Third-party API).
- Identify Components: What backend services handle the request? (Auth Service, DB, Cache, Payment Gateway).
- Map the Request: Draw the arrow from Actor to the first component.
- Map the Response: Draw the return arrow back.
- Handle Asynchrony: Use dashed lines for callbacks or background jobs.
Example Scenario: User Login
- User: Enters credentials.
- Frontend: Sends POST /login.
- API Gateway: Validates token, routes to Auth Service.
- Auth Service: Queries Database.
- Database: Returns user hash.
- Auth Service: Generates JWT.
- Frontend: Receives token.
When drawing this, label the arrows with the HTTP method and endpoint. Mention security headers like Authorization or Content-Type. This adds technical depth without cluttering the visual.
Deep Dive: Class Diagram Strategy 🧠
Class diagrams show how code is organized. In an interview, this often relates to design patterns or domain modeling.
Key Considerations:
- Visibility: Use
+for public,-for private,#for protected. - Scope: Distinguish static vs. instance members (underlined text).
- Interfaces: Clearly separate abstract contracts from concrete implementations.
Common Patterns to Highlight:
- Singleton: Only one instance exists. Useful for configuration or logging.
- Factory: Creates objects without specifying exact class.
- Observer: One object changes state, others are notified.
Do not list every method. Group methods by functionality or show the critical ones that define the contract. Too much detail obscures the architecture.
Communication Techniques During Diagramming 🗣️
The diagram is a tool for conversation. If you draw in silence, you miss the opportunity to correct course. Narrate your process as you draw.
Verbal Cues:
- “I am starting with the user actor here…”
- “This line represents the API call…”
- “I am adding a cache layer here to reduce latency…”
- “This dashed line indicates an asynchronous job…”
Handling Interruptions:
If the interviewer asks a question, stop drawing. Answer the question. Then resume. Do not draw over a question mark. If the direction changes, redraw the section cleanly rather than scribbling over it.
Common Mistakes to Avoid ⚠️
Avoid these errors to maintain credibility and clarity.
| Mistake | Impact | Correction |
|---|---|---|
| Tight Coupling | Shows poor modularity | Use interfaces to decouple components. |
| Missing Error Handling | Shows incomplete logic | Include error paths or fallback mechanisms. |
| Over-Engineering | Confuses the scope | Keep the MVP (Minimum Viable Product) in mind. |
| Inconsistent Notation | Looks unprofessional | Stick to one style throughout. |
| Ignoring Data Flow | Hard to trace logic | Label arrows with data types or payloads. |
Advanced Tips for System Design 🌐
For senior roles, the focus shifts from basic diagrams to scalability and reliability.
Scalability Indicators
- Load Balancers: Draw them in front of web servers.
- Replication: Show multiple database instances.
- Sharding: Indicate data partitioning.
Reliability Indicators
- Redundancy: Show backup paths.
- Queues: Use message queues to decouple services.
- Caching: Place caches between clients and databases.
Preparation Plan for Candidates 📅
Consistent practice is required to build muscle memory for whiteboarding.
- Week 1: Notation Review. Study the symbols for Class, Sequence, and Use Case diagrams. Practice drawing them by hand.
- Week 2: Simple Systems. Pick a small app (e.g., Todo List) and draw its architecture. Focus on the database schema and API endpoints.
- Week 3: Complex Systems. Pick a large system (e.g., URL Shortener). Focus on load balancing and caching strategies.
- Week 4: Mock Interviews. Have a peer critique your diagrams. Ask them to point out ambiguity.
Final Thoughts on UML in Interviews 💡
UML is a language of engineering. Like any language, fluency comes with practice. In an interview, your diagrams are not just drawings; they are evidence of your design process.
Focus on clarity over aesthetics. A simple, clean diagram that is understood by everyone is superior to a complex, beautiful one that confuses the audience. Use the diagrams to drive the conversation toward trade-offs, risks, and solutions.
By mastering these visual tools, you demonstrate that you can architect systems that are maintainable, scalable, and robust. This is the hallmark of a strong engineer.
Summary of Key Takeaways 📌
- Visuals Aid Communication: Use diagrams to reduce ambiguity.
- Select the Right Diagram: Match the diagram type to the problem (Structure vs. Behavior).
- Standardize Notation: Keep symbols consistent throughout the session.
- Narrate Your Process: Explain what you are drawing as you draw it.
- Practice Hand-Drawn Skills: Rely on whiteboard skills, not software.
Apply these principles in your next technical assessment. Good luck with your preparation and your interviews. 🚀

