


In the fast-paced world of modern commerce, operational bottlenecks are more than just minor inconveniences; they are silent profit killers. For a boutique retail apparel brand, a simple 48-hour lag in inventory synchronization can lead to high order cancellation rates and dissatisfied customers. To resolve these complex issues, professionals require a professional Value Stream Mapping tool that provides clarity without the steep learning curve. The AI-powered Value Stream Mapping editor by Visual Paradigm offers a sophisticated, data-driven environment designed to transform chaotic workflows into streamlined, efficient value chains. By focusing on the end-to-end flow of value, this tool empowers operations managers and Lean practitioners to visualize delays, identify waste, and implement sustainable improvements with confidence.
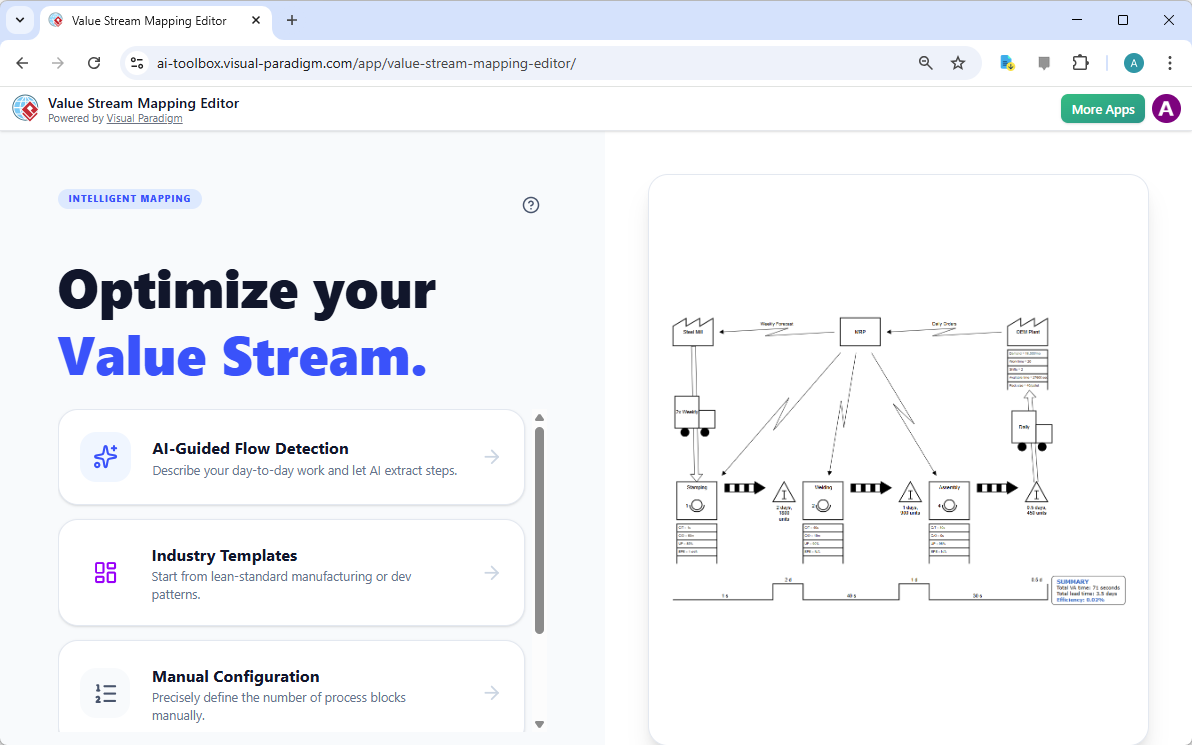
Upon launching the application, users are greeted with an intuitive interface that simplifies the daunting task of process documentation. The startup screen offers three distinct paths: AI-Guided Flow Detection, Industry Templates, or Manual Configuration. This flexibility ensures that whether you are a seasoned Lean consultant or a business analyst new to the methodology, you can begin your journey toward operational excellence without feeling overwhelmed. The interface is designed to be a calm, productive space where the primary focus remains on process logic rather than technical troubleshooting.
Step 1: Utilizing AI-Guided Flow Detection for Rapid Mapping
The most innovative way to begin is through the “AI-Guided Flow Detection” feature. Instead of manually drawing boxes and arrows, you simply describe your current business challenge in plain language. For instance, a retail brand might describe a scenario where online order placement is disconnected from physical inventory levels at the distribution center. This easy-to-use Value Stream Mapping software takes this description and prepares to extract the core value steps automatically, acting as a digital consultant that understands the nuances of supply chain logistics.
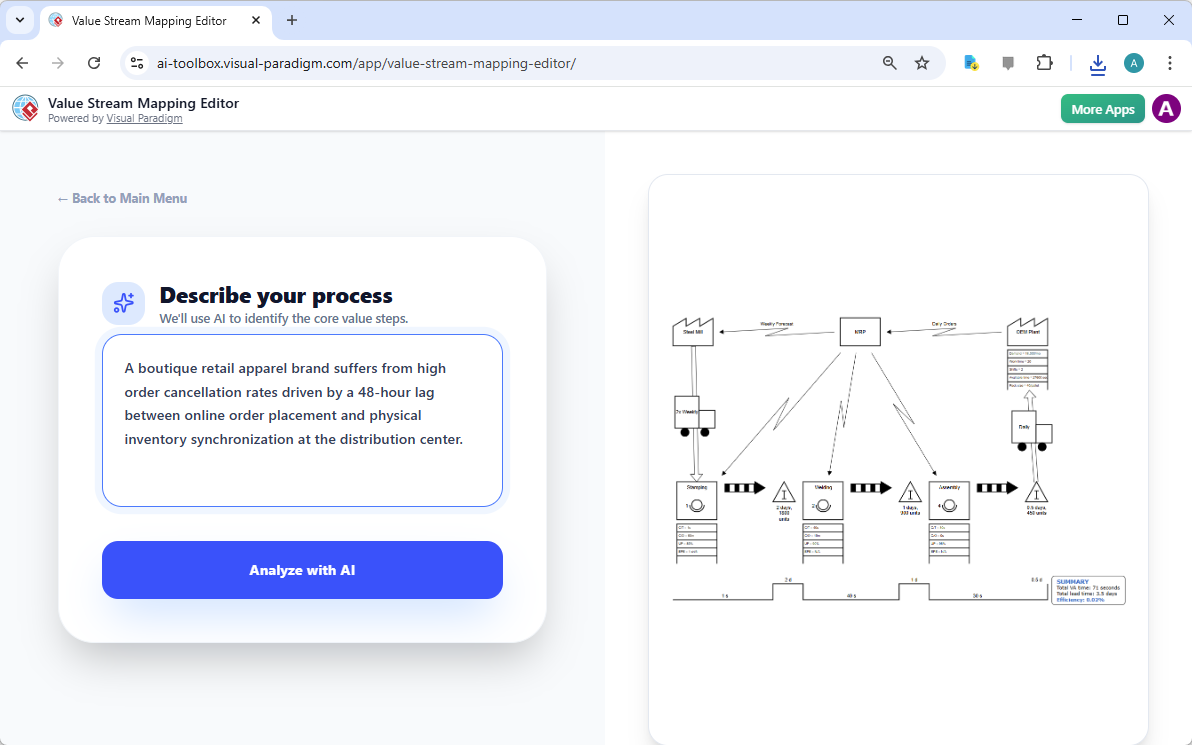
Once you click “Analyze with AI,” the tool processes the text and identifies the essential components of your value stream. It looks for triggers, suppliers, customers, and the specific sequence of events that move a product from “order” to “delivery.” This capability significantly reduces the time spent in the initial drafting phase, allowing teams to move straight to the critical task of analysis and optimization. It is a reassuring experience, knowing that the foundation of your map is built on intelligent logic.
Understanding the Visual Output
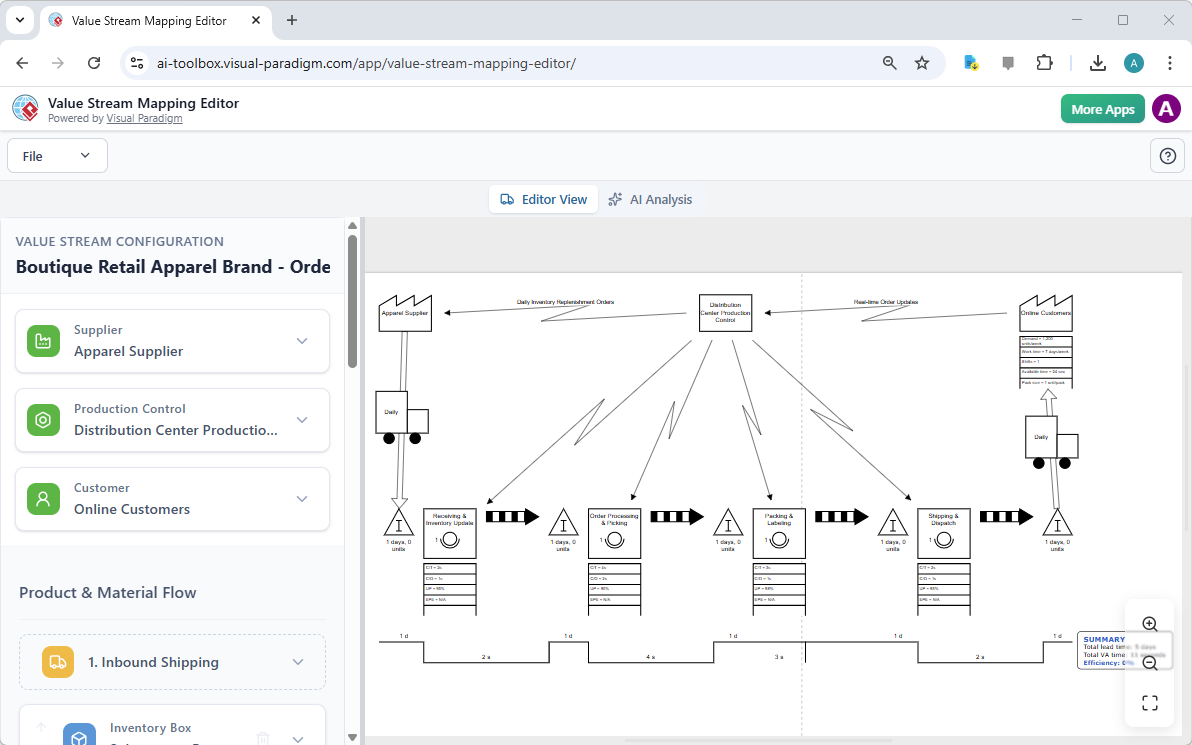
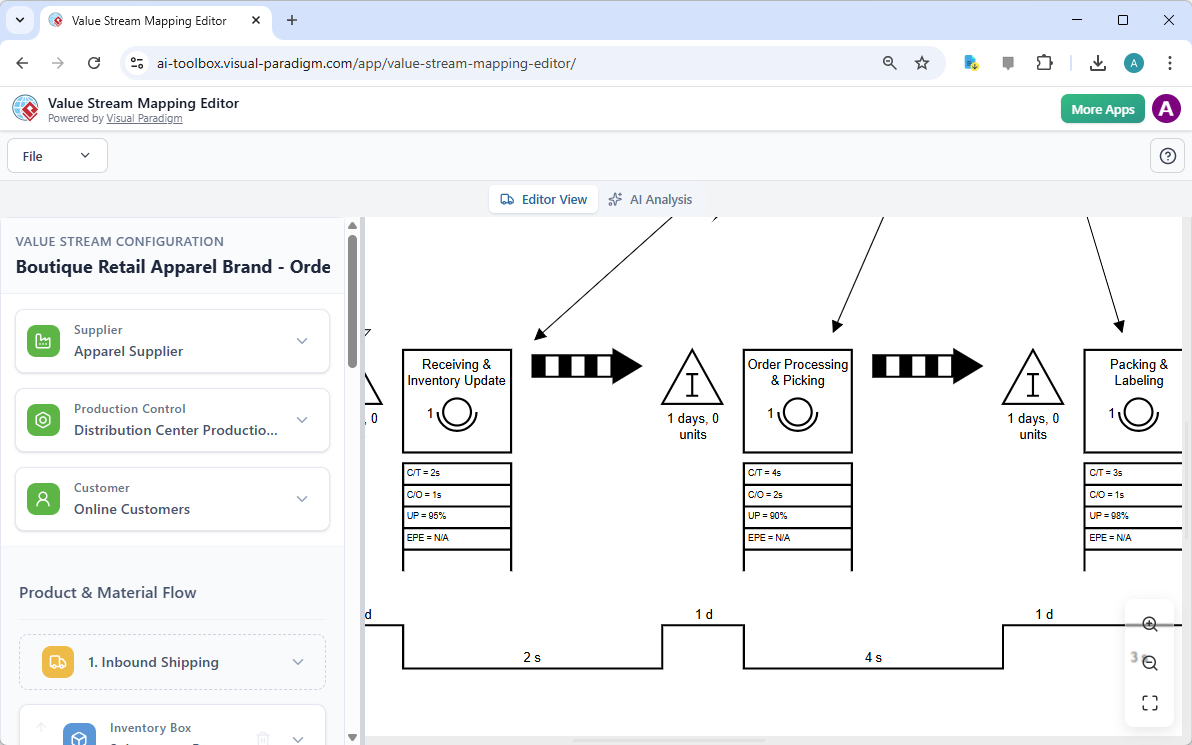
The generated diagram provides a comprehensive overview of the entire process, including material and information flows. In the context of our retail example, you can see how apparel suppliers interact with production control and how real-time order updates flow back to the online customer. The best AI VSM maker ensures that these complex relationships are depicted using standardized symbols, making the diagram immediately readable for all stakeholders. A zoomed view allows you to inspect specific nodes, such as the “Receiving & Inventory Update” or “Order Processing” stages, ensuring every detail is captured accurately.
Step 2: Refining Data with the Integrated Editor
While the AI provides a fantastic starting point, the true power of this online Value Stream Mapping editor lies in its split-pane interface. On the left side, you will find a structured configuration pane where you can fine-tune the data for each process step. This is where you enter critical metrics such as Cycle Time (C/T), Changeover Time (C/O), and Uptime percentages. The beauty of this system is that as you update these numbers, the diagram on the right updates in real-time. It feels like sculpting your process with data, providing instant visual feedback on how small changes affect the overall lead time.
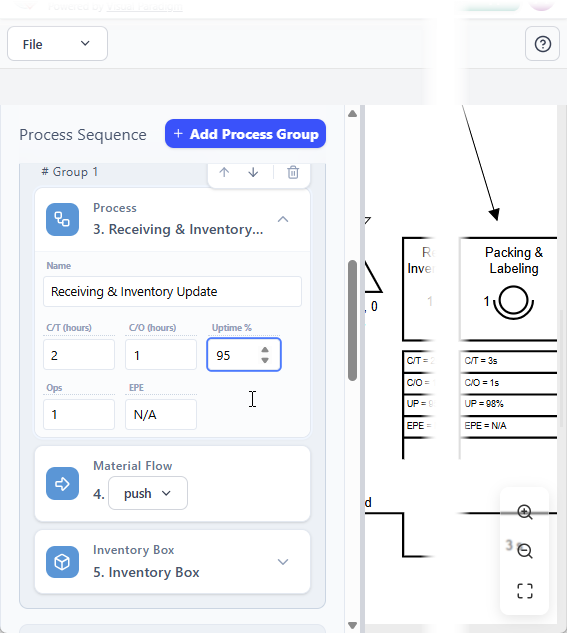
The structured data editor enforces consistency across the organization. It guides you through defining “Inventory Boxes” between process steps, which are often the primary sources of waste. By quantifying the number of units sitting idle and the time they spend waiting, the tool highlights the “non-value-added” time that inflates your total Lead Time. This data-driven approach removes the guesswork, allowing you to base your decisions on quantitative reality rather than intuition.
Quick Summary: Key Takeaways for Process Excellence
-
Data-Driven Accuracy: Automatically sync diagram visuals with process metrics like cycle time and uptime.
-
AI-Powered Efficiency: Generate initial flows from simple text descriptions to save hours of manual drawing.
-
Unified Visualization: See both material flows and information flows in a single, professional-grade map.
-
Waste Identification: Easily spot the seven types of waste, specifically “waiting” and “inventory.”
-
Collaborative Clarity: Export high-quality PNGs to share insights and gain stakeholder buy-in effortlessly.
Step 3: Unlocking Insights with AI Analysis
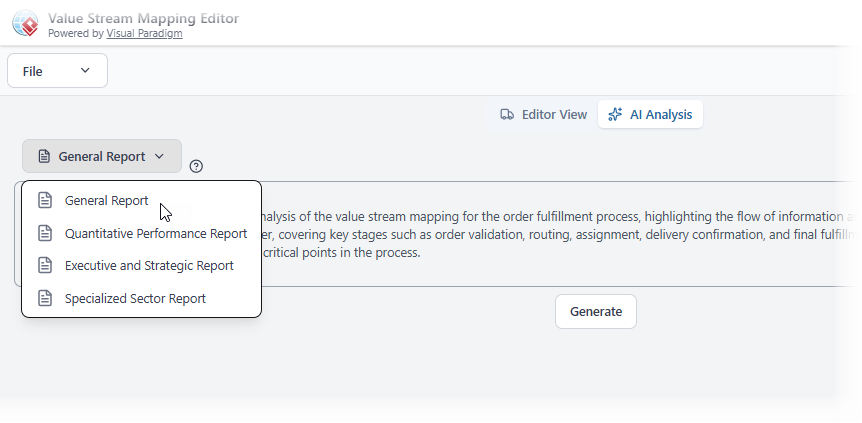
After your current state map is documented, the software offers a “Consultant-in-a-Box” experience through the AI Analysis tab. This feature analyzes your specific VSM data to identify patterns of waste and bottlenecked steps. By clicking “Generate,” you can choose from various reporting styles, including General Reports, Quantitative Performance Reports, or Executive and Strategic Reports. This allows the user to communicate findings at the appropriate level of detail, whether it is for the frontline staff or the boardroom.
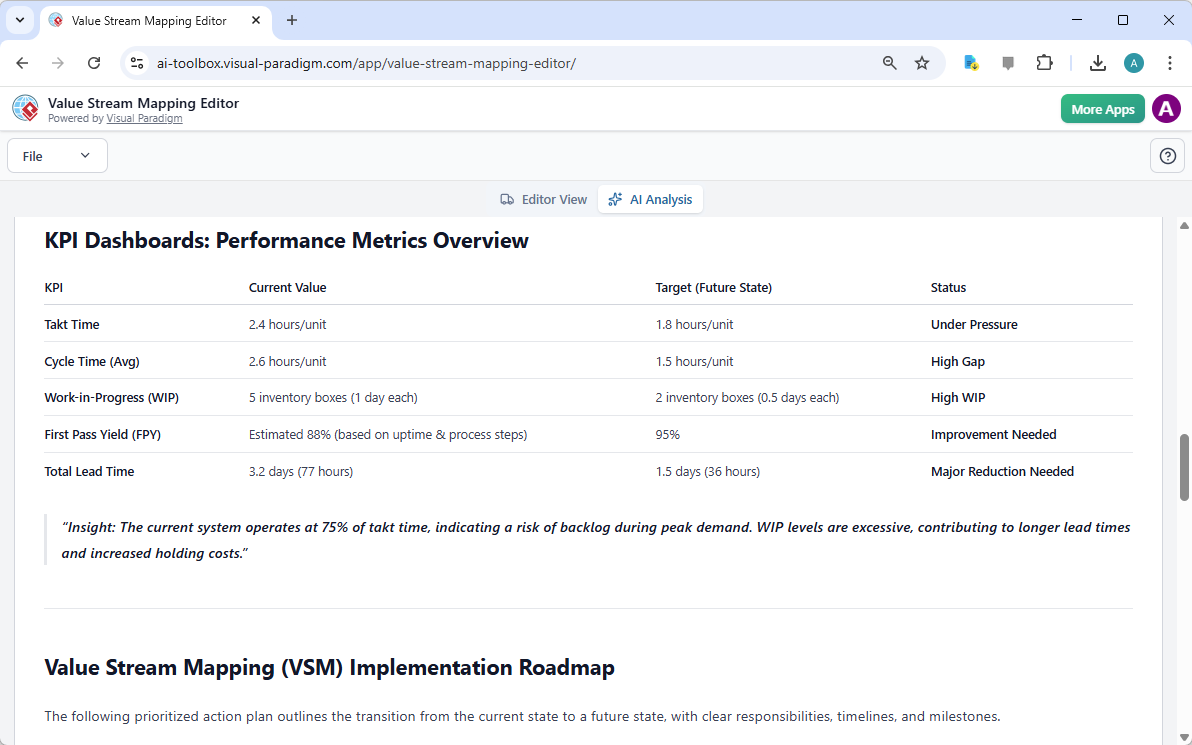
The resulting Executive and Strategic report is a masterclass in professional communication. It provides a KPI dashboard that compares your “Current Value” against “Target (Future State)” metrics. For example, it might highlight that your Total Lead Time is 3.2 days while the target is 1.5 days, flagging it as a “Major Reduction Needed” area. These reports provide actionable insights and even a prioritized implementation roadmap, making the transition from analysis to action smooth and structured.
Glossary of Core VSM Terminology
To maximize the effectiveness of your professional VSM software, it is essential to understand the core metrics calculated by the editor:
Term Definition Lead Time The total time a product spends in the system, from order to delivery. Cycle Time The time spent actively working on a product (Value-Added Time). Takt Time The pace of production needed to meet customer demand. Inventory Materials or information waiting between process steps (Non-Value-Added).
Conclusion: Transforming Process into Progress
In conclusion, the AI-powered Value Stream Mapping editor by Visual Paradigm is more than just a drawing tool; it is a strategic asset for any organization committed to continuous improvement. By combining the ease of AI-guided generation with the precision of a data-driven editor, it removes the anxiety typically associated with process mapping. Professionals can now move from a state of logistical confusion to a clear, actionable roadmap for efficiency. Whether you are addressing inventory lags in retail or bottlenecks in manufacturing, the path to optimization is now clearer than ever.
Ready to eliminate waste and optimize your value delivery? Experience the future of process improvement today. You can try the Value Stream Mapping Editor now by visiting the AI Toolbox application or learn more about the advanced features on the official AI VSM tool page. Streamline your workflows and empower your team with the insights they need to succeed.
Related Links
Value stream mapping (VSM) is a strategic framework used to visualize workflows and identify inefficiencies within a process, ultimately helping teams to eliminate waste and improve value delivery. By mapping end-to-end processes, organizations can track lead times, identify bottlenecks, and align their capabilities with strategic goals.
-
What Is Value Stream Mapping? A Complete Guide: A foundational guide explaining how VSM visualizes workflows to identify and eliminate waste, thereby improving process efficiency.
-
Comprehensive Guide to Value Stream Mapping: This article covers the fundamentals, benefits, and step-by-step procedures for continuous business improvement through mapping.
-
Value Stream Mapping Tool – Visual Paradigm: An overview of a tool designed to help organizations streamline processes and improve operational efficiency through visual analysis.
-
Value Stream Mapping as an Artifact of the Vision Phase: Explores how VSM serves as a key artifact to align teams and define strategic direction during the early phases of product development.
-
How to Use Value Stream Mapping in Six Sigma Projects: Details how VSM reveals process bottlenecks and reduces cycle times to enable data-driven improvements in Six Sigma contexts.
-
Eliminate Waste with Value Stream Mapping: A Practical Approach: A practical guide for identifying and removing the eight types of waste in both manufacturing and service-based environments.
-
Value Stream to Capability Cross-Mapping View in ArchiMate: A specialized template for enterprise architects to map value streams directly to organizational capabilities using the ArchiMate framework.
-
Free Value Stream Mapping Templates: A library of ready-to-use templates designed to accelerate process mapping and help teams uncover improvement opportunities.
-
Value Stream Mapping Software – Visual Paradigm Online: An introduction to cloud-based software for collaborative workflow design and optimization for lean manufacturing.
-
Value Stream Mapping Template for Bottleneck Identification: A professional template used to visualize end-to-end processes and track critical metrics like lead times.
