


Building a customer journey map is more than just drawing a line across a whiteboard. It is a strategic exercise that requires deep research, cross-functional collaboration, and a commitment to understanding the human behind the transaction. When executed correctly, this process reveals critical insights about how users interact with your brand, where they face friction, and where they find delight. This guide provides a structured approach to planning a customer journey mapping project from the ground up.
Whether you are improving a specific touchpoint or overhauling your entire customer experience strategy, the foundation remains the same. You need clarity on your goals, access to the right data, and a team dedicated to acting on the findings. This document outlines the essential phases of the planning process, ensuring you avoid common pitfalls and build a map that drives tangible business value.
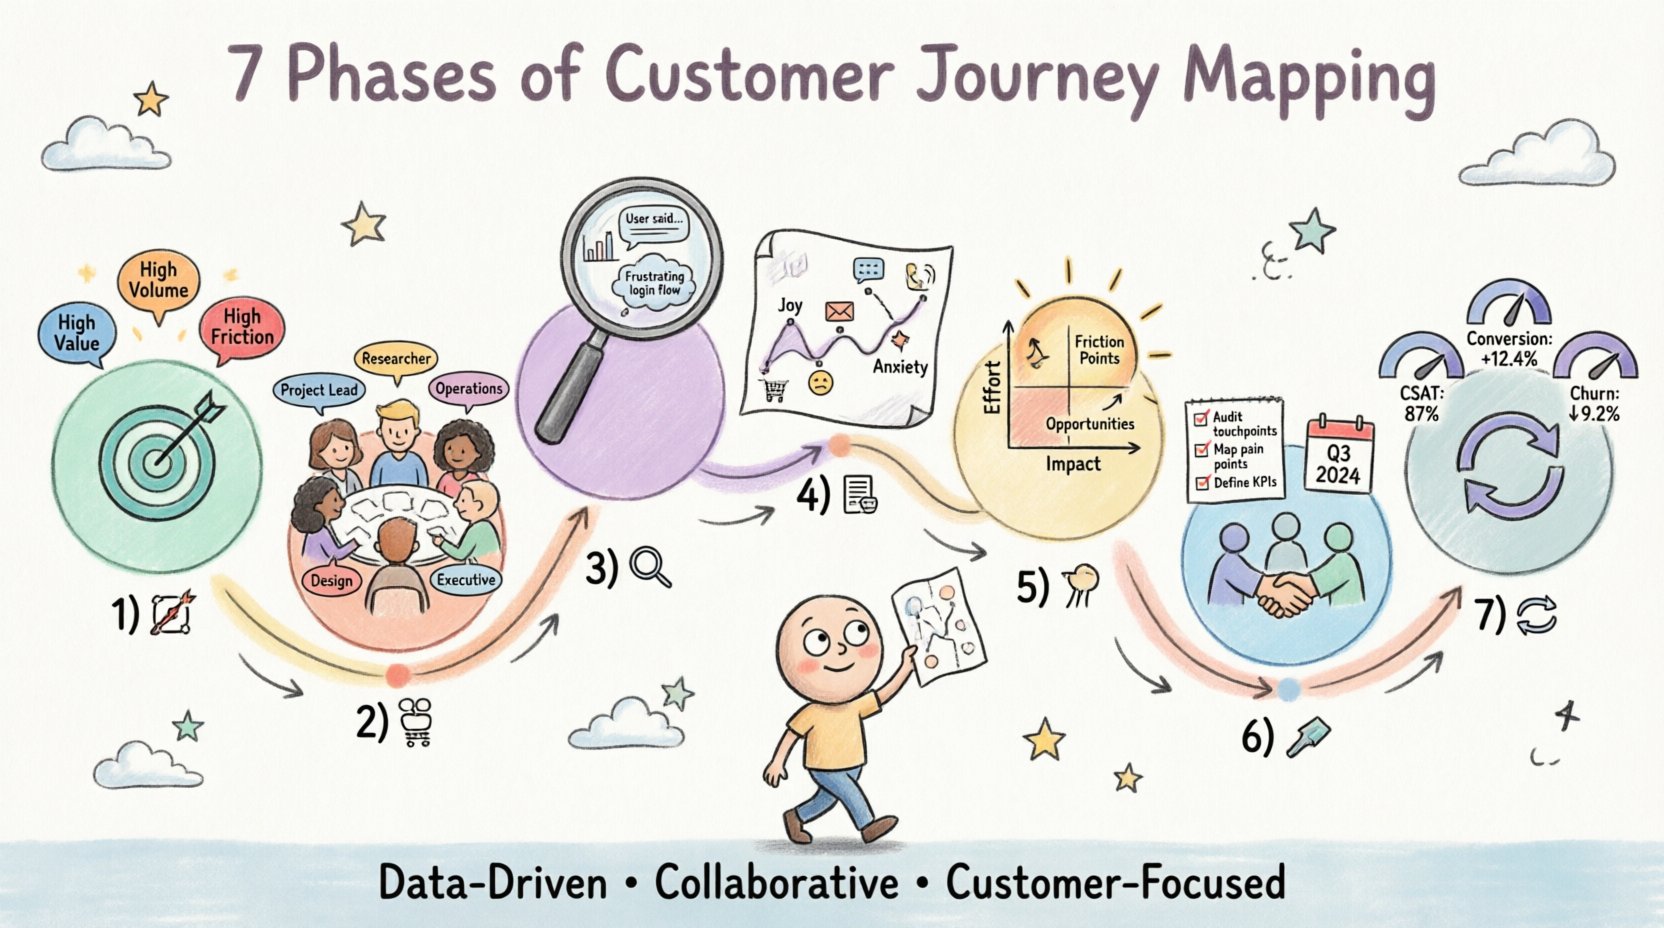
Phase 1: Defining Scope and Objectives 🎯
Before drawing a single line or interviewing a single user, you must establish the boundaries of your project. A journey map that attempts to cover every interaction a customer has with a company over five years is often too broad to be actionable. Instead, focus on a specific scenario or persona.
1.1 Selecting the Right Persona
Your map should center on a specific user type. Generalizing across all customer segments dilutes the insights. Consider the following criteria when choosing a persona:
- High Value: Does this segment drive significant revenue or retention?
- High Volume: Is this a common experience that affects many users?
- High Friction: Are there known complaints or drop-off points associated with this group?
By narrowing your focus, you ensure the resulting map is relevant to a specific set of users, making it easier for stakeholders to empathize and take action.
1.2 Setting Clear Goals
Define what success looks like for this project. Are you trying to reduce support ticket volume? Increase conversion rates? Improve onboarding speed? Your objectives will dictate the level of detail required in the mapping process.
Common goals include:
- Identifying gaps in the service delivery process.
- Aligning internal teams on the customer experience.
- Validating assumptions about user behavior.
- Prioritizing product features based on user needs.
Phase 2: Assembling the Team and Stakeholders 👥
A journey map is a cross-functional artifact. It is not the responsibility of a single department. To create an accurate representation, you need input from various parts of the organization. This phase involves identifying who needs to be involved and ensuring their time is allocated.
2.1 Key Roles and Responsibilities
Successful mapping requires a mix of skills. Below is a breakdown of typical roles involved in the project:
| Role | Responsibility |
|---|---|
| Project Lead | Owns the timeline, facilitates workshops, and synthesizes findings. |
| Researcher | Gathers qualitative data, conducts interviews, and analyzes feedback. |
| Operations | Provides context on backend processes and service limitations. |
| Design/Product | Ensures the map reflects the actual digital or physical interface. |
| Executive Sponsor | Removes roadblocks and champions the initiative internally. |
2.2 Securing Stakeholder Buy-In
Resistance often arises when teams feel their internal processes are being scrutinized. To mitigate this, communicate that the goal is to improve the customer experience, not to assign blame. Hold introductory meetings to explain the process and invite team members to contribute their perspectives early. This ensures the map reflects the reality of how the business operates, not just how it is intended to operate.
Phase 3: Data Collection and Research 🔍
A map without data is merely an opinion. To ensure accuracy, you must gather evidence from multiple sources. Relying solely on internal assumptions will likely lead to a map that does not match user reality.
3.1 Quantitative Data Sources
Numbers tell you what is happening. Use your data systems to identify patterns in user behavior. Look for:
- Funnel Analytics: Where do users drop off?
- Support Logs: What are the most common complaints?
- Transaction Data: How long does the process take on average?
- Survey Scores: Net Promoter Score (NPS) or Customer Satisfaction (CSAT) trends.
3.2 Qualitative Data Sources
Numbers tell you why users feel a certain way. Qualitative research adds the emotional layer to your map. Consider the following methods:
- Customer Interviews: One-on-one conversations to understand motivations.
- Usability Testing: Observing users as they attempt to complete tasks.
- Shadowing: Watching customers interact with your staff or service.
- Feedback Analysis: Reviewing open-ended responses from surveys and reviews.
3.3 Internal Knowledge
Do not overlook the insights held by your own employees. Frontline staff often know the most about customer pain points. Conduct internal workshops or interviews with support agents, sales representatives, and account managers to capture institutional knowledge.
Phase 4: Drafting the Journey Map 📝
With data in hand, you are ready to construct the visual representation of the journey. This stage involves organizing the information into a logical flow. While tools vary, the structure of the content remains consistent.
4.1 Defining the Stages
Divide the journey into distinct phases. These should represent the natural progression of the user’s experience. Common stages include:
- Awareness: The user discovers your brand.
- Consideration: The user evaluates your offering.
- Acquisition: The user makes a purchase or signs up.
- Retention: The user continues to engage.
- Advocacy: The user recommends you to others.
4.2 Mapping Touchpoints
For each stage, list the specific interactions the user has with your organization. A touchpoint is any point of contact, whether digital or physical. Examples include:
- Viewing an advertisement on social media.
- Reading a product description on a website.
- Speaking with a sales representative.
- Receiving a confirmation email.
- Using the product or service.
- Contacting customer support.
4.3 Capturing Emotions and Pain Points
The most valuable part of the map is the emotional curve. Plot the user’s sentiment at each touchpoint. Use a scale to denote satisfaction levels. Alongside this, explicitly mark pain points. Ask:
- Where does the user feel confused?
- Where do they experience delays?
- What information is missing at this step?
Phase 5: Identifying Friction and Opportunities 🚀
Once the map is drafted, the real work begins: analysis. A map is useless if you do not extract insights from it. This phase involves reviewing the visual data to find areas for improvement.
5.1 Gap Analysis
Compare the expected journey with the actual journey. Look for discrepancies. If a user expects a quick refund but the process takes weeks, that is a gap. If a user expects personalization but receives a generic email, that is a missed opportunity. Document these gaps clearly.
5.2 Prioritizing Improvements
You cannot fix everything at once. Use a prioritization framework to decide which issues to address first. Consider the impact and effort required for each fix. A high-impact, low-effort change should be prioritized over a high-impact, high-effort one. Common factors for prioritization include:
- Frequency: How many users are affected?
- Severity: How much does this impact the user’s experience?
- Strategic Alignment: Does this align with current business goals?
Phase 6: Roadmapping and Implementation 🛠️
Insights must translate into action. This phase involves creating a plan to address the identified gaps. Assign ownership for each initiative to ensure accountability.
6.1 Creating Action Items
Convert insights into specific tasks. For example, if users are confused during the checkout process, an action item might be “Redesign the checkout form to reduce field count.” Ensure every item has a clear owner and a deadline.
6.2 Cross-Departmental Alignment
Many journey improvements require coordination between teams. For instance, a change in the website may require updates to the email marketing workflow. Hold alignment meetings to ensure all departments understand their role in the implementation plan. Use the journey map as a shared reference point during these discussions.
Phase 7: Monitoring and Iteration 🔄
A journey map is a living document. Customer behaviors change, technology evolves, and market conditions shift. A map created today may be obsolete in six months. Establish a review cycle to keep the map relevant.
7.1 Defining Success Metrics
Before launching improvements, define how you will measure success. Link your action items to specific metrics. If you reduced friction in the onboarding process, track the time-to-value or the activation rate. Regularly review these metrics to validate that your changes are having the desired effect.
7.2 Updating the Map
Schedule periodic reviews to update the journey map. This can be done quarterly or annually. During these reviews, incorporate new data and feedback. If a specific touchpoint has been overhauled, ensure the map reflects the new reality. This keeps the organization aligned with the current customer experience.
Common Challenges in Journey Mapping ⚠️
Even with a solid plan, you may encounter obstacles. Being aware of common challenges allows you to navigate them proactively.
- Internal Bias: Teams often assume they know what the customer wants. Fight this by relying on direct user research rather than internal opinions.
- Siloed Data: Information is often trapped in different departments. Invest time in aggregating data from marketing, sales, and support into a central view.
- Scope Creep: Projects can expand indefinitely. Stick to the initial scope defined in Phase 1 to ensure completion.
- Lack of Follow-Through: Teams often create maps that sit on a shelf. Ensure there is a dedicated budget and timeline for the implementation phase.
Key Metrics for Success 📊
To validate the effectiveness of your journey mapping project, track the following indicators over time:
- Customer Satisfaction Score (CSAT): Measures satisfaction at specific touchpoints.
- Churn Rate: Indicates how well you are retaining customers.
- Conversion Rate: Shows the effectiveness of the acquisition journey.
- Time-to-Resolution: Measures efficiency in support interactions.
- Employee Adoption: Tracks how well internal teams use the map for decision-making.
Data Collection Matrix 📋
To ensure comprehensive research, utilize the following matrix to track your data sources during the planning phase.
| Information Type | Source | Frequency |
|---|---|---|
| Behavioral | Analytics Platforms | Continuous |
| Attitudinal | Surveys & Interviews | Quarterly |
| Operational | CRM & Ticketing Systems | Monthly |
| Market | Competitor Analysis | Annually |
Moving Forward 🏁
Planning a customer journey mapping project is a significant investment of time and resources, but the payoff is a deeper understanding of your audience. By following a structured approach, you ensure that the resulting map is accurate, actionable, and aligned with business goals.
Remember that the map is a tool, not the end product. The true value lies in the changes you make based on the insights it reveals. Keep the process collaborative, data-driven, and focused on the customer. With a solid plan in place, you can transform complex user experiences into clear opportunities for growth.
Start by defining your scope, gathering your team, and collecting your data. The path to a better customer experience begins with a single step in the planning process.

