


Building a bridge between business goals and user needs requires precision. Customer journey mapping is not merely a visualization exercise; it is a strategic diagnostic tool. It reveals where friction occurs, where delight happens, and how resources are allocated across touchpoints. To execute this effectively, organizations need a structured approach. This guide provides a comprehensive checklist divided into actionable phases.
Whether you are refining an existing strategy or starting from scratch, following a disciplined process ensures that the resulting map reflects reality rather than assumptions. The following sections detail twenty specific steps, organized to guide you from initial preparation through to ongoing optimization.
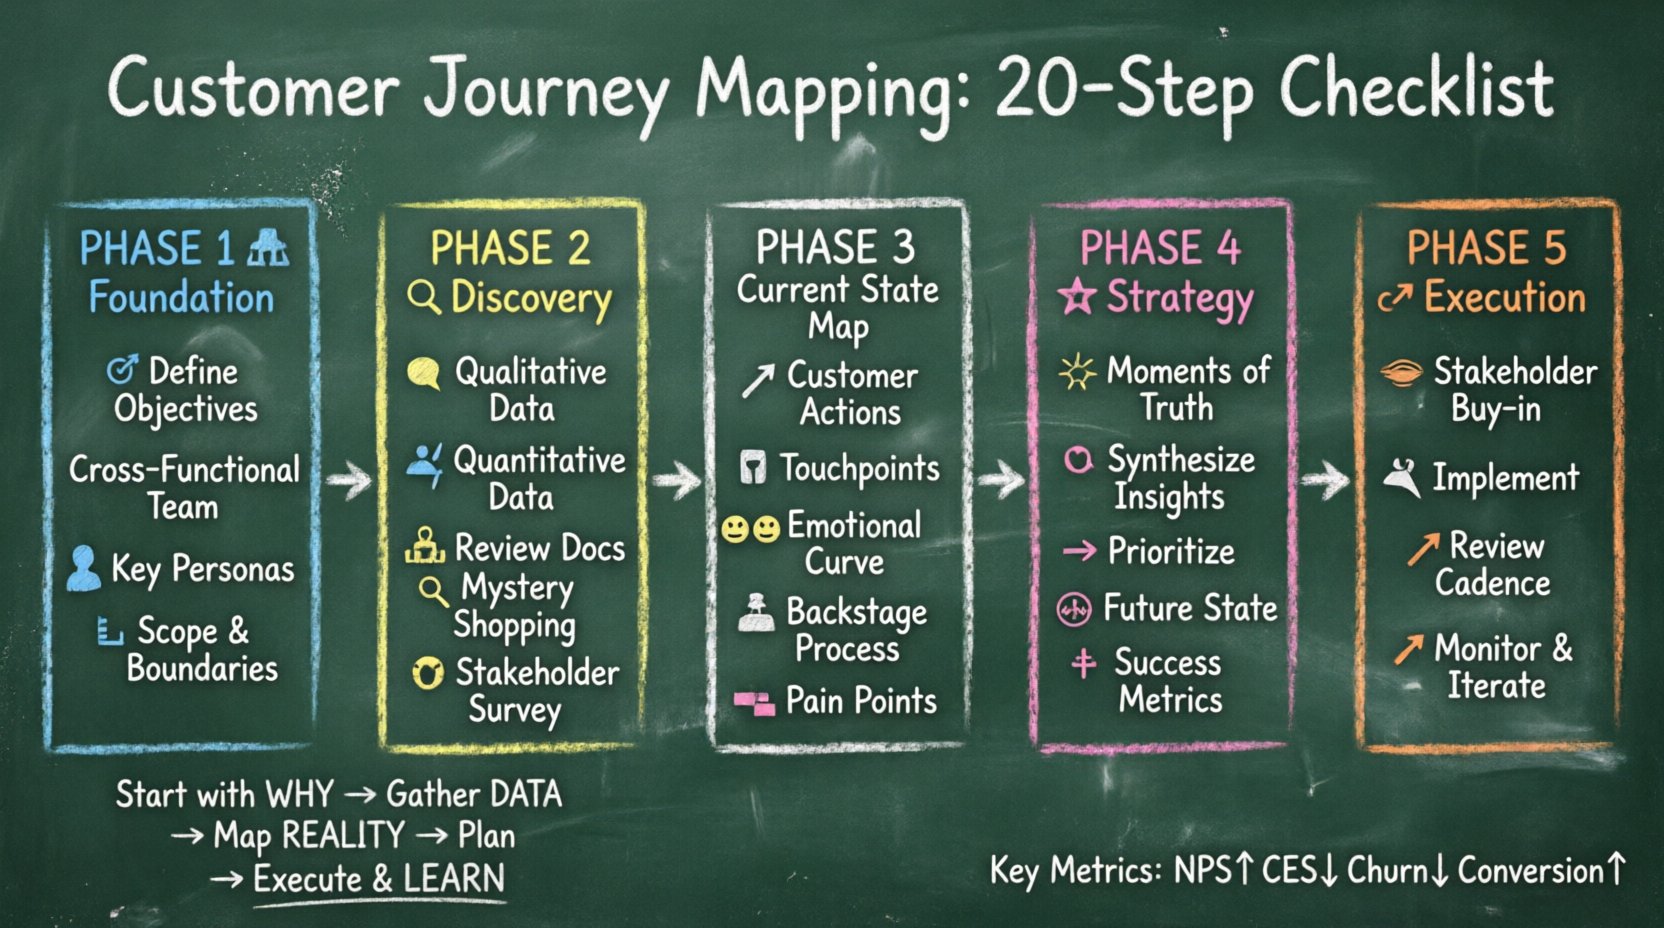
Phase 1: Foundation and Preparation 🏗️
Before drawing a single line, the groundwork must be solid. Ambiguity at this stage leads to a map that fails to drive action. These initial steps focus on alignment and scope definition.
Step 1: Define Clear Objectives 🎯
Start by articulating the specific purpose of the mapping exercise. Is the goal to reduce churn? Improve onboarding speed? Enhance support satisfaction? Without a defined target, the team risks gathering irrelevant data. Write down the primary business question the map must answer.
Step 2: Assemble a Cross-Functional Team 👥
Journey mapping cannot be a siloed activity. It requires insights from marketing, sales, product, and support. Each department holds a piece of the puzzle. Ensure representatives from all relevant functions participate in the workshops to validate their internal processes against the external user experience.
Step 3: Identify Key Personas 🧑💼
A generic journey often fails to resonate with specific user types. Segment your audience based on behavior, demographics, or intent. Select the primary persona that represents the most critical business outcome. Focus your mapping efforts on this specific group to maintain clarity and relevance.
Step 4: Set Scope and Boundaries 📏
A journey can span years or minutes. Determine the start and end points of the map. Does it begin at the first ad impression or the first login? Does it end at the first purchase or the renewal? Defining these boundaries prevents scope creep and keeps the analysis focused.
Phase 2: Discovery and Data Collection 🔍
Data drives the map. Relying on intuition alone creates a fictional narrative. This phase is dedicated to gathering empirical evidence from both internal systems and external feedback.
Step 5: Gather Qualitative Data 🗣️
Conduct interviews and focus groups to understand the emotional context behind user actions. Ask open-ended questions about their frustrations, motivations, and expectations. Qualitative insights reveal the “why” behind the numbers.
Step 6: Collect Quantitative Data 📊
Complement interviews with analytics. Review conversion rates, drop-off points, and session durations. Look for trends in customer support tickets and churn data. Quantitative evidence validates the qualitative stories and highlights high-volume friction points.
Step 7: Review Existing Documentation 📝
Audit current customer service scripts, marketing copy, and product documentation. These artifacts represent the official voice of the organization. Discrepancies between official messaging and user perception often signal areas for improvement.
Step 8: Conduct Mystery Shopping 🕵️
Experience the journey as a customer would. Walk through the entire process yourself. Note every interaction, every loading screen, and every help request. This first-hand experience uncovers usability issues that data alone might miss.
Step 9: Survey Stakeholders 🤝
Interview internal staff who interact with customers daily. Frontline support agents and sales representatives often know the most about recurring complaints. Their insights provide a backstage view of the operational realities.
Phase 3: Mapping the Current State 📉
Now that data is collected, it is time to visualize the “As-Is” state. This creates a shared understanding of the current reality before proposing changes.
Step 10: Map Customer Actions 🚶
List the specific steps a user takes to achieve their goal. Break these down into granular actions rather than broad phases. For example, instead of “Purchase,” use “Select Product,” “Add to Cart,” “Enter Shipping,” and “Confirm Payment.”
Step 11: Identify Touchpoints 📱
Label every interaction point between the user and the organization. These include emails, ads, website pages, phone calls, and physical interactions. Ensure every channel is accounted for to see the full picture.
Step 12: Chart Emotional Landscape 😊😠
Plot the emotional trajectory of the user at each step. Are they anxious during checkout? Excited during onboarding? Use a curve or scale to represent sentiment. This highlights moments of high stress or delight that need attention.
Step 13: Document Internal Processes (Backstage) 🏢
Visualize what happens behind the scenes to support each touchpoint. How does a support ticket route to a specialist? How is an order processed? Understanding the internal workflow reveals bottlenecks that delay customer resolution.
Step 14: Highlight Pain Points 🚧
Mark every moment of friction, confusion, or delay. These are the critical issues that must be resolved. Use color coding or icons to distinguish between minor annoyances and major blockers that cause abandonment.
Phase 4: Analysis and Strategy 💡
A map is useless without actionable insights. This phase involves interpreting the data to identify opportunities for improvement and strategic shifts.
Step 15: Identify Moments of Truth 🌟
Pinpoint the specific interactions that define the customer’s perception of the brand. These are high-stakes moments where the user decides whether to stay or leave. Prioritize resources to ensure these moments are flawless.
Step 16: Synthesize Insights 🧩
Look for patterns across the data. Do multiple users drop off at the same stage? Is there a common complaint about billing clarity? Group these findings to identify systemic issues rather than isolated incidents.
Step 17: Prioritize Opportunities 🚀
Not all improvements can happen at once. Use a framework based on impact and effort to rank opportunities. Focus on quick wins that build momentum while planning long-term structural changes.
Step 18: Design Future State (To-Be) 🏁
Create a second map representing the ideal experience. Show how processes should look after improvements are implemented. This serves as a blueprint for product and service development teams.
Step 19: Define Success Metrics 📏
Establish key performance indicators to measure the impact of changes. Metrics might include Net Promoter Score (NPS), Customer Effort Score (CES), or reduction in support ticket volume. Ensure these metrics align with the initial objectives.
Phase 5: Execution and Iteration 🔄
The final phase ensures the map translates into tangible results and remains relevant over time.
Step 20: Secure Stakeholder Buy-in 📢
Present the findings and the proposed future state to leadership and department heads. Secure commitment to the budget and resources required for implementation. Without executive support, initiatives often stall.
Step 21: Implement Changes 🛠️
Translate the roadmap into action items. Assign ownership for each task. Update user interfaces, rewrite content, or retrain staff as needed. Track progress against the timeline defined in the strategy phase.
Step 22: Establish Review Cadence 📅
Customer behavior evolves. Schedule regular reviews of the journey map. Update it whenever significant product changes occur or market conditions shift. Treat the map as a living document, not a static archive.
Step 23: Monitor and Measure 📈
Continuously track the defined success metrics. Compare current performance against the baseline established in the preparation phase. Use the data to validate whether the implemented changes delivered the expected results.
Step 24: Iterate and Refine 🔄
Based on the monitoring results, adjust the strategy. If a fix did not work, investigate why. If a new pain point emerged, add it to the map. Continuous refinement is the only way to maintain a competitive advantage.
Roles and Responsibilities Matrix 👥
Clarity in roles prevents confusion during execution. Use the table below to assign ownership for key activities within the journey mapping process.
| Role | Primary Responsibility | Key Output |
|---|---|---|
| Project Lead | Overall coordination and timeline management | Project Plan & Timeline |
| UX Researcher | Conducting interviews and data analysis | Research Findings Report |
| Product Manager | Defining functional requirements and features | Product Roadmap |
| Marketing Lead | Ensuring brand alignment and messaging consistency | Communication Strategy |
| Support Lead | Identifying operational friction and support gaps | Process Improvement List |
Common Pitfalls to Avoid ⚠️
Even with a solid checklist, teams often stumble on execution. Awareness of common errors helps mitigate risks.
- Assumption over Evidence: Relying on what leadership thinks the user wants rather than what the user actually does.
- Overly Broad Scope: Trying to map every possible journey at once leads to paralysis. Focus on one critical path first.
- Ignoring Internal Process: Focusing only on the front-end while ignoring the back-end systems that support the user experience.
- Lack of Action: Creating a beautiful map that sits in a folder without triggering any changes or projects.
- Static Documentation: Treating the map as a one-time deliverable instead of a living strategy document.
Key Metrics for Success 📊
Measuring the impact of journey mapping requires specific indicators. Track these metrics to evaluate performance.
| Metric | Definition | Target |
|---|---|---|
| Customer Effort Score (CES) | Measure of how easy it is for a customer to use a service | Lower Score (Easier) |
| Net Promoter Score (NPS) | Measure of customer loyalty and likelihood to recommend | Higher Score |
| Conversion Rate | Percentage of users who complete a desired action | Increasing Trend |
| Churn Rate | Percentage of customers who stop using the service | Decreasing Trend |
| Time to Resolution | Average time taken to resolve a customer issue | Lower Duration |
Final Thoughts on Strategic Alignment 🎯
The value of a customer journey map lies in its ability to align internal operations with external expectations. It forces an organization to look through the eyes of the customer and identify gaps between what is promised and what is delivered. Success is not measured by the number of pages created, but by the tangible improvements in user satisfaction and business outcomes.
By adhering to this twenty-step framework, teams can ensure a methodical approach to experience design. The process demands discipline and honest data, but the payoff is a cohesive strategy that drives growth and loyalty. Keep the map accessible, keep the data fresh, and keep the focus on the human element behind every transaction.

