


Starting a customer journey mapping project without prior experience can feel overwhelming. You might worry about missing critical details or creating a document that gathers dust. However, the core value of this exercise lies in the conversation it sparks, not just the final diagram. This guide provides a structured approach for beginners to build meaningful insights about how people interact with your brand. We will break down the process into manageable steps, ensuring you build a foundation that supports growth without requiring specialized training or expensive tools.
Customer journey mapping is simply the visualization of the process a person goes through to achieve a goal with your company. It helps teams understand the customer’s perspective, identify gaps in service, and align internal departments around a shared vision. Whether you work in marketing, product development, or operations, this skill enhances empathy and drives better decision-making.
Why Start Mapping Without Experience? 🤔
Many professionals hesitate because they believe they need data science backgrounds or design certifications. This is a misconception. The most effective maps often come from qualitative observations and cross-functional collaboration. Here is why you should begin now:
- Cost-Effective: You do not need proprietary software to start. A whiteboard and sticky notes are sufficient.
- Team Alignment: The act of mapping forces different teams to agree on what the customer experience looks like.
- Problem Identification: It highlights friction points that might otherwise remain hidden in internal reports.
- Scalability: You can start small with one specific persona and expand as you learn.
Phase 1: Laying the Foundation 🧱
Before drawing a single line, you must define the scope. A map that tries to cover every possible interaction will become too complex to maintain. Focus on a specific scenario or user type.
Define Your Persona
Who are you mapping for? A journey map for a new customer is different from one for a loyal advocate. Create a basic profile that includes:
- Demographics: Age, location, job role (if B2B).
- Goals: What is the primary objective they want to achieve?
- Motivations: Why does this goal matter to them?
- Current Behavior: How do they currently solve this problem?
Do not rely on assumptions. Even if you lack experience, you can gather this information by interviewing colleagues who interact with these customers daily. Sales teams often have rich stories about objections. Support teams know where people get stuck. Combine these anecdotes to form a preliminary persona.
Set the Boundaries
A journey map needs a clear start and end point. For a purchase scenario, the start might be the first time they hear your name, and the end could be the first successful use of the product. For a support scenario, the start is the realization of a problem, and the end is the resolution. Defining these boundaries prevents scope creep.
Phase 2: Gathering the Right Data 📊
Experience is not strictly necessary if you have data. However, raw numbers tell only half the story. You need to combine quantitative data with qualitative insights.
Qualitative Research Methods
These methods help you understand the why behind the actions:
- Customer Interviews: Conduct one-on-one conversations. Ask open-ended questions like, “Can you walk me through the last time you used this service?” Let them speak freely without guiding them toward a specific answer.
- Shadowing: If possible, observe customers using your product or visiting your physical location. Watch where they hesitate, what they click, and how long they wait.
- Feedback Forms: Look at existing survey data. Search for keywords like “confusing,” “slow,” or “helpful.” These indicate emotional states at specific touchpoints.
Quantitative Research Methods
These methods help you understand the what and how often:
- Web Analytics: Use traffic data to see where users drop off in a funnel.
- Support Logs: Analyze ticket volume. High volume on a specific topic indicates a process failure.
- Transaction Data: Look at repeat purchase rates or churn points.
Combine these sources to create a timeline of events. You are building a narrative, not just a list of statistics.
Phase 3: Visualizing the Path 👁️
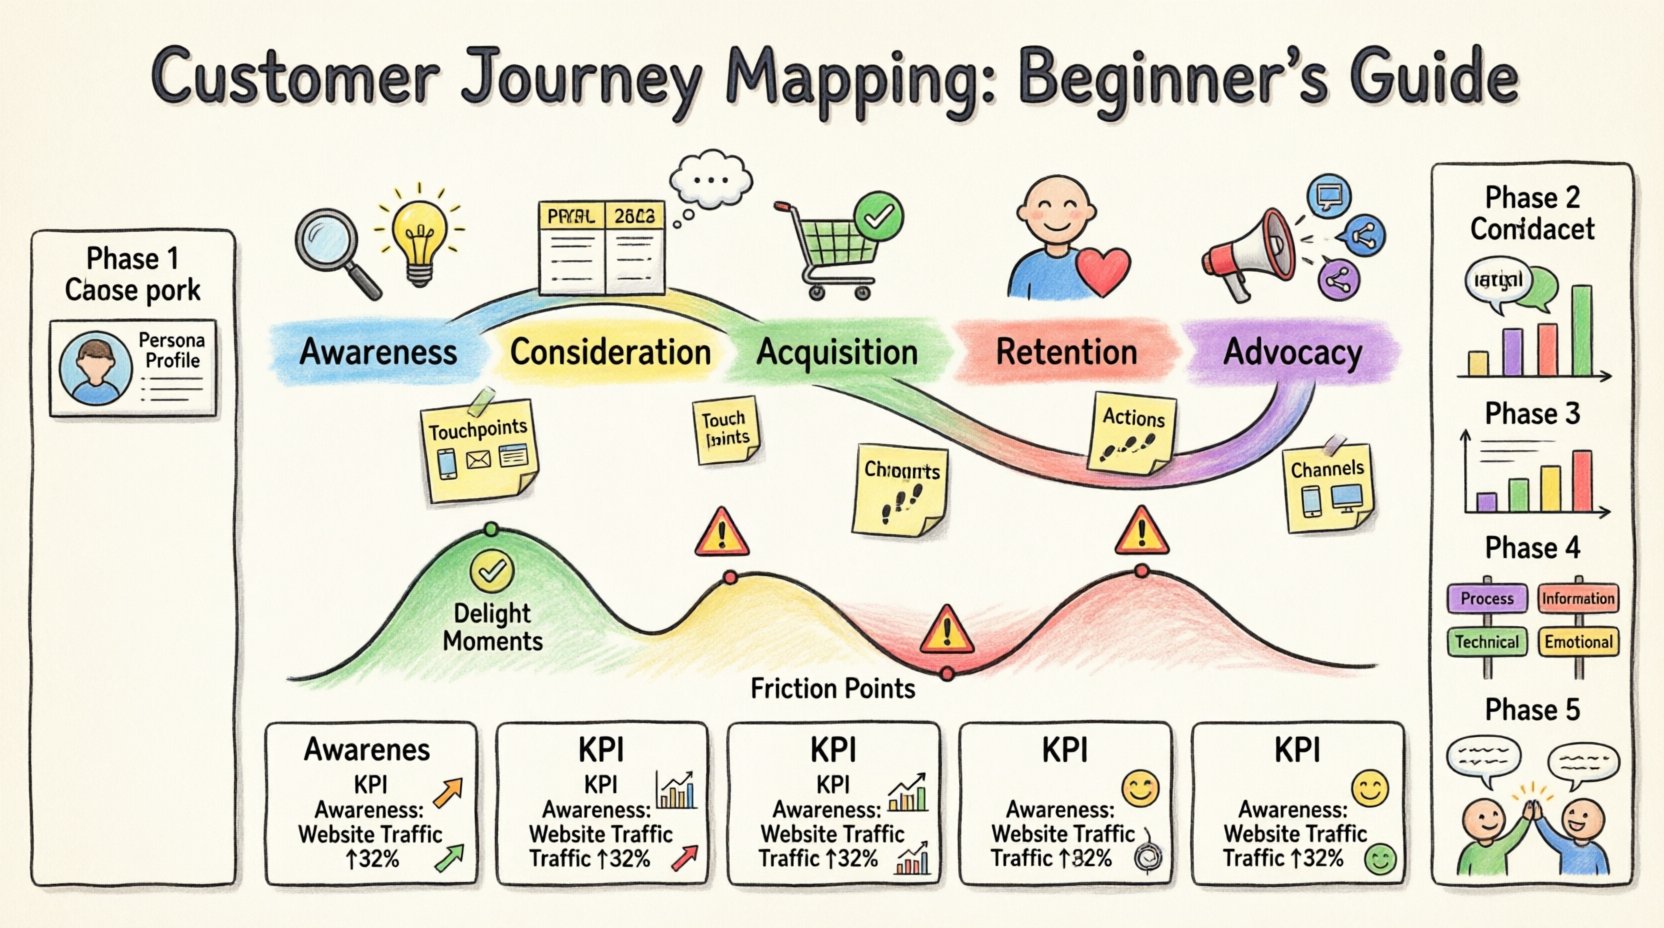
Now that you have information, it is time to structure it. The standard structure follows the chronological flow of the customer experience. You can group these stages into five main categories, though specific industries may vary.
| Stage | Customer Mindset | Key Question to Answer |
|---|---|---|
| Awareness | Discovery and Curiosity | How did they find us? |
| Consideration | Evaluation and Comparison | Why are they choosing us over others? |
| Acquisition | Decision and Transaction | Is the process smooth and secure? |
| Retention | Usage and Satisfaction | Do they get value from the product? |
| Advocacy | Loyalty and Recommendation | Are they telling others about us? |
When creating the visual representation, consider the following elements for each stage:
- Touchpoints: Where does the customer interact with you? (Website, email, phone call, in-store visit).
- Actions: What specific steps do they take at that touchpoint?
- Emotions: How are they feeling? (Frustrated, excited, confused, relieved). You can use a simple line graph to track sentiment across the journey.
- Channels: Which medium are they using? (Mobile app, desktop, social media).
For your first map, physical tools are often best. Use a large whiteboard or a long sheet of paper. Place sticky notes for each action. This allows you to move things around easily as you discover new information. It makes the process collaborative rather than solitary.
Phase 4: Identifying Friction Points 🛑
The primary goal of this exercise is to find where the journey breaks down. Friction points are moments where the customer experiences unnecessary difficulty, confusion, or delay. These are your opportunities for improvement.
Types of Friction
Friction is not always negative; some friction is necessary (like security checks), but it must be justified. Look for these types of issues:
- Process Friction: Too many steps required to complete a task. For example, forcing a user to create an account before viewing a product price.
- Information Friction: Missing or unclear information. Does the customer know what to do next?
- Technical Friction: Slow loading times, broken links, or mobile compatibility issues.
- Emotional Friction: Feeling ignored, undervalued, or confused by tone of voice.
Mapping the Emotions
Draw a line across the bottom of your map representing the customer’s emotional state. Mark peaks and valleys. A peak represents a moment of delight. A valley represents a moment of frustration. If you see a valley in the middle of a critical path, that is a priority fix.
Ask your team: “What is the worst part of this journey for the customer?” Often, the answer reveals the most valuable insight. Document these pain points clearly on the map using red markers or distinct icons.
Phase 5: Validating Your Map ✅
Creating the map is only half the work. You must verify that it reflects reality. A map built on assumptions will lead to incorrect solutions. Validation ensures accuracy.
Internal Validation
Share the draft map with teams you have not involved yet. Ask them if the process described matches their reality. Sales might know a step you missed. Engineering might know a technical constraint you overlooked. This step breaks down silos and ensures everyone agrees on the truth.
External Validation
Take the map back to the customers. Present the scenario to a test group. Ask them to validate the steps. “Did you actually do this step?” “Did you feel frustrated here?” If they say no, update the map. This feedback loop is essential for credibility.
Common Pitfalls to Avoid ⚠️
Even with a structured approach, beginners often make predictable mistakes. Being aware of these can save you time and effort.
| Common Mistake | Consequence | How to Fix It |
|---|---|---|
| Assuming a Linear Path | Customers often loop back or skip steps. | Add branches and loops to the diagram. |
| Focusing Only on Digital | Ignoring offline interactions (phone, email, in-person). | Include all channels in the timeline. |
| Making it Too Detailed | The map becomes unreadable and unusable. | Focus on high-level stages, not every click. |
| Ignoring Internal Processes | Maps show what the customer sees, not how the company works. | Include a “Backend” layer for internal actions. |
| One Map to Rule All | One map cannot fit every user type. | Create specific maps for different personas. |
Remember that a journey map is a hypothesis. It is a snapshot of your current understanding. As you gather more data, it will evolve. Do not treat it as a final artifact.
Measuring Impact Over Time 📈
Once you have identified friction points and implemented changes, you need to know if it worked. Establish Key Performance Indicators (KPIs) that align with the journey stages.
- Awareness: Track website traffic, social media impressions, and brand search volume.
- Consideration: Monitor time on site, pages per session, and content downloads.
- Acquisition: Watch conversion rates, cart abandonment rates, and cost per acquisition.
- Retention: Measure active user rates, session frequency, and feature adoption.
- Advocacy: Track Net Promoter Score (NPS), referral rates, and online reviews.
Review these metrics periodically. If a friction point was removed, you should see a positive trend in the relevant metric. If the metric does not move, revisit the map. The change might not have addressed the root cause.
Keeping the Map Alive 🔄
A journey map that sits on a server or in a binder is useless. It must be a living document that guides daily operations. Here is how to maintain it:
- Regular Reviews: Schedule quarterly reviews with stakeholders to update the map based on new data.
- Onboarding Tool: Use the map to train new employees. It gives them context on how their role affects the customer.
- Decision Framework: When proposing new features or changes, ask: “How does this impact the journey map?” If it doesn’t align, reconsider the proposal.
- Share Widely: Ensure the map is accessible to everyone in the organization, not just the marketing team.
Conclusion
Starting a customer journey mapping project without prior experience is entirely feasible. The process relies more on empathy and observation than technical expertise. By following these steps—defining the scope, gathering data, visualizing the path, identifying friction, validating findings, and measuring results—you can build a robust understanding of your customer’s needs.
The journey map is a tool for alignment. It brings the team together around the truth of the customer experience. It transforms abstract data into a human story. As you refine your approach and gather more insights, your maps will become more accurate and impactful. Start with a simple version, iterate based on feedback, and let the data guide your improvements. The goal is not perfection on the first try, but continuous progress toward a better experience for everyone.
Remember, the customer is the expert in their own journey. Your role is to listen, observe, and facilitate their success. With patience and a structured approach, you can create a map that drives real value for your organization and your users.

