


Creating a customer journey map is one of the most impactful ways to understand the people you serve. It transforms abstract data into a visual narrative that highlights every interaction a person has with your organization. This process requires empathy, research, and a structured approach. By visualizing the experience from the user’s perspective, you can identify friction points and opportunities for improvement. This guide walks you through the entire process without relying on specific software tools.
What Is a Customer Journey Map? 🤔
A customer journey map is a diagram that illustrates the steps a customer goes through in engaging with a company. It is not just a flowchart of actions; it includes the customer’s feelings, motivations, and pain points at each stage. Think of it as a story told through data. It helps teams align on a shared understanding of the customer experience.
Without this visual aid, teams often operate in silos. Marketing might focus on acquisition, while support handles the aftermath. A map bridges these gaps, showing the full lifecycle. Below is a breakdown of the core components typically found in a comprehensive map.
| Component | Description | Example |
|---|---|---|
| Personas | The specific archetypes of users you are mapping for. | “Tech-Savvy Sarah” |
| Stages | High-level phases of the relationship. | Discovery, Purchase, Onboarding |
| Touchpoints | Specific interactions where the customer meets the brand. | Email, Website, Phone Call |
| Actions | What the customer actually does at each touchpoint. | Clicks button, fills form |
| Thoughts | What the customer is thinking during the action. | “Is this secure?” |
| Emotions | The feeling associated with the stage. | Excited, Frustrated, Relieved |
| Pain Points | Obstacles that hinder the experience. | Long wait times, Broken links |
| Opportunities | Areas where improvement can be made. | Add FAQ section |
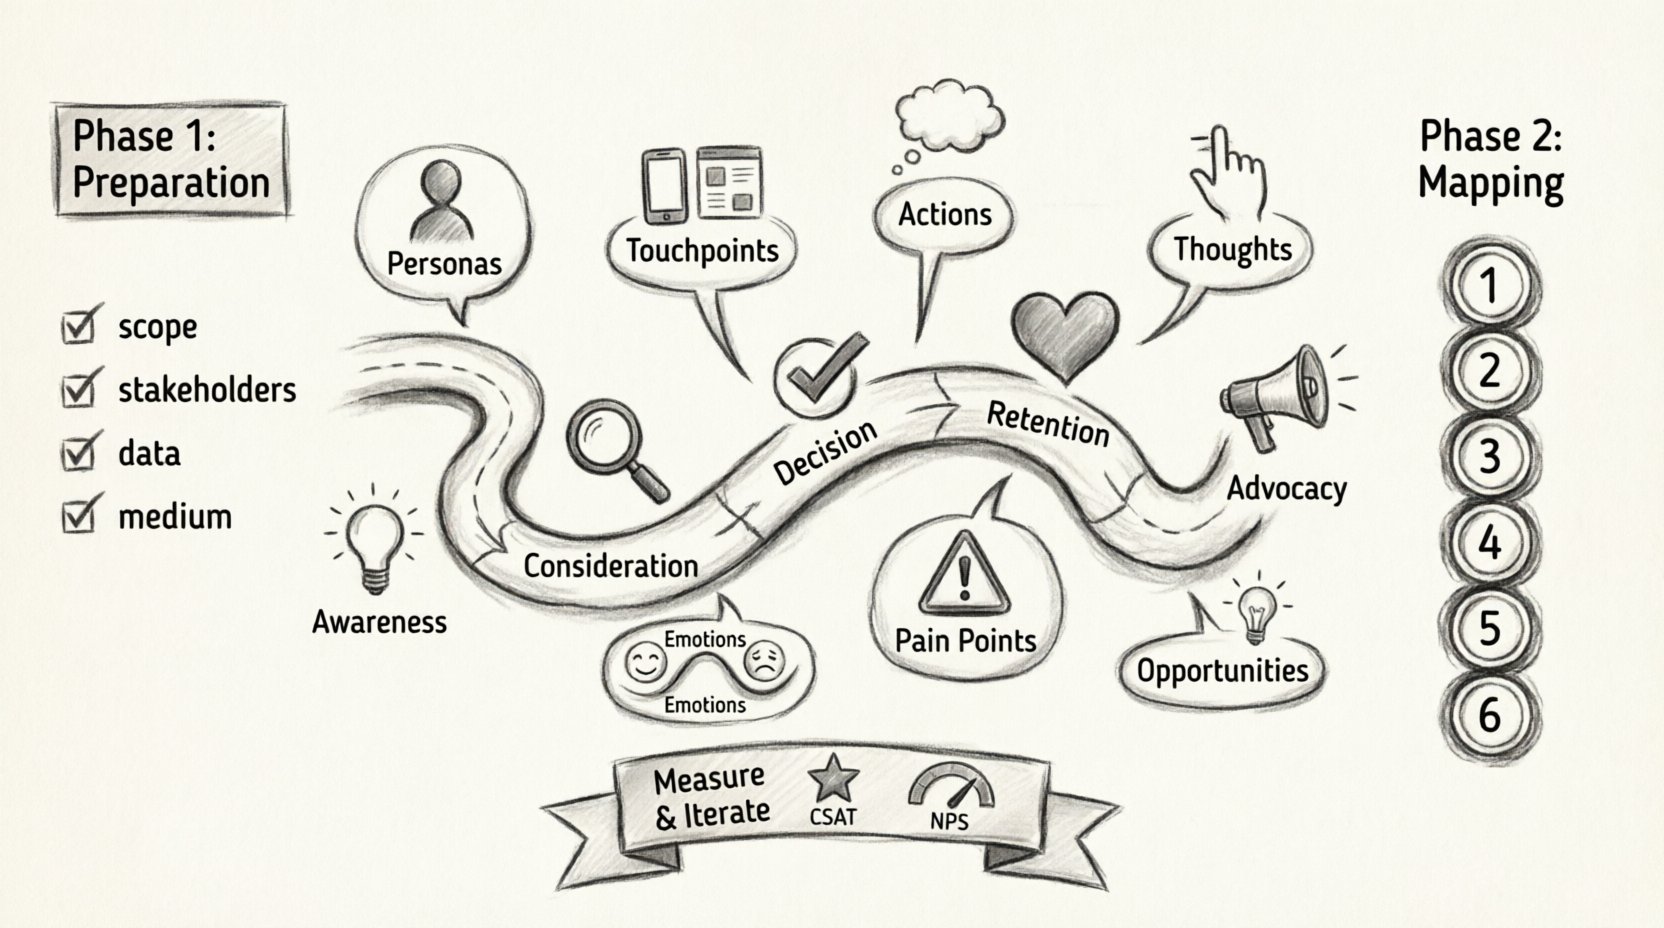
Phase 1: Preparation and Setup 🛠️
Before drawing any lines or placing sticky notes, you must prepare the groundwork. A map built on assumptions will fail to reflect reality. Proper preparation ensures the map is actionable and accurate.
- Define the Scope: Are you mapping the entire lifecycle or a specific journey like “First Purchase”? Focus on one scenario to start.
- Gather Stakeholders: Include members from sales, support, product, and marketing. Diverse perspectives prevent blind spots.
- Collect Data: You need quantitative and qualitative data. Look at analytics, survey results, and customer interview transcripts.
- Choose a Medium: Select a physical whiteboard or a digital collaboration space. The medium matters less than the accessibility for the team.
Phase 2: Step-by-Step Mapping Process 📝
Once the foundation is laid, follow this sequence to build the map effectively. This sequence ensures logical flow and comprehensive coverage.
Step 1: Define the Personas 👤
A journey map is not for everyone; it is for a specific type of user. You must define who is experiencing this journey. Create a detailed profile that includes demographics, goals, and behaviors.
- Demographics: Age, location, job title.
- Goals: What are they trying to achieve? (e.g., “Save time,” “Reduce costs”).
- Behaviors: How do they typically behave online or offline?
- Motivations: Why do they choose your product over a competitor’s?
Write these details at the top of your map. Every decision made during the mapping process should align with this persona’s reality.
Step 2: Identify the Stages 🚩
Divide the journey into chronological phases. While specific names vary by industry, most journeys follow a standard progression. For a service business, these might look like:
- Awareness: The customer realizes they have a problem.
- Consideration: They look for solutions and compare options.
- Decision: They choose a provider and make a purchase.
- Retention: They use the product or service.
- Advocacy: They recommend the brand to others.
Ensure the stages reflect the actual duration and nature of the relationship. A one-time purchase differs significantly from a subscription model.
Step 3: Map the Touchpoints 📲
A touchpoint is any moment where the customer interacts with your brand. These can be digital, physical, or human. List every possible interaction within each stage.
- Digital: Social media ads, website pages, mobile app notifications, email newsletters.
- Physical: Store visits, packaging, printed brochures, signage.
- Human: Sales calls, customer support chats, onboarding sessions.
Be thorough. Missing a touchpoint can hide a critical pain point. For example, a customer might read an ad (digital) but then call support (human) before buying. Both need to be represented.
Step 4: Chart the Actions and Thoughts 🧠
Now, detail what happens at each touchpoint. What does the customer do? What goes through their mind? This layer adds the psychological context to the physical actions.
- Actions: “Downloads brochure,” “Adds item to cart,” “Calls hotline.”
- Thoughts: “Is the price fair?” “Will this integrate with my tools?” “Who will help me if it breaks?”
Use quotes from actual customer interviews if available. This grounds the map in real language rather than internal jargon.
Step 5: Plot Emotions and Pain Points 😊😫
This is the most critical part of the journey map. Emotions fluctuate throughout the journey. Plot these on a graph or within the rows of your map. You are looking for the peaks and valleys of the experience.
- High Points: Moments of delight. Where did the customer feel supported? Where was the experience seamless?
- Low Points: Moments of frustration. Where did the process break down? Where did the customer feel ignored?
- Pain Points: Specific barriers causing the low emotions. Examples include slow loading times, confusing navigation, or unresponsive support.
Visualize this with a line graph or color coding. Red indicates high friction, while green indicates positive sentiment. This visual cue helps stakeholders quickly identify areas needing immediate attention.
Step 6: Identify Opportunities 💡
For every pain point identified, there should be a corresponding opportunity. This transforms the map from a diagnostic tool into a strategic asset. Brainstorm solutions collaboratively.
- Process Improvement: Can we automate a manual step?
- Content Creation: Do they need more information at this stage?
- Training: Does the support team need better scripts?
- Technology: Does the platform need a feature update?
Assign ownership for each opportunity. Who will implement the change? What is the timeline? This ensures the map leads to action.
Common Mistakes to Avoid ⚠️
Even experienced teams make errors when creating journey maps. Avoid these pitfalls to ensure your map remains useful.
- Mapping the Wrong Journey: Don’t try to map the experience of every user type at once. Focus on one primary persona per map.
- Internal Bias: Avoid mapping how you think the customer behaves. Map how they actually behave based on data.
- Ignoring Internal Processes: A customer journey often relies on backend workflows. If the internal process fails, the customer experience fails. Consider the service blueprint alongside the map.
- Creating and Forgetting: A map is a living document. If you do not update it as products change, it becomes obsolete quickly.
- Too Much Detail: While thoroughness is good, excessive detail can clutter the visual. Keep it readable for the entire team.
Measuring Success and Maintenance 📊
Once the map is complete, you must track its impact. How do you know if the changes you made improved the experience? Use key performance indicators (KPIs) relevant to the journey stages.
- Conversion Rates: Did the friction points reduce drop-offs?
- Customer Satisfaction (CSAT): Do post-interaction scores improve?
- Net Promoter Score (NPS): Does advocacy increase after fixing pain points?
- Support Ticket Volume: Do tickets decrease for specific issues identified in the map?
Schedule regular reviews of the journey map. Quarterly reviews are often sufficient to keep the data fresh. Update the map whenever a major product launch or process change occurs. This keeps the organization aligned with the current reality of the customer.
The Value of Empathy in Mapping ❤️
At its core, journey mapping is an exercise in empathy. It forces teams to step out of their internal roles and walk in the shoes of the user. This shift in perspective is often the most valuable outcome of the process.
When a developer understands that a specific button placement causes confusion, they are more likely to fix it. When a marketer understands that a specific email timing feels intrusive, they can adjust the schedule. The map humanizes the data.
Remember that the goal is not perfection. The goal is continuous improvement. No experience is flawless, but a mapped journey provides a clear path toward making it better. By following this structured approach, you build a foundation for a customer-centric culture.
Final Thoughts on Execution ✅
Executing a customer journey map requires time and commitment. It is not a one-off activity but a strategic discipline. Start small. Map one key scenario. Gather feedback. Iterate. Over time, these maps become the blueprint for your organization’s growth.
Focus on the data, listen to the customers, and visualize the connections. The resulting map will serve as a constant reference point for decision-making. Ensure that the insights derived from this work lead to tangible changes in products, services, and communications. This is how you turn a diagram into a competitive advantage.
Keep the map visible. Display it in meeting rooms or pin it on digital dashboards. Let it guide your daily work. When the customer experience is central to your operations, success follows naturally.

