


In the modern business landscape, understanding the customer is no longer optional—it is the foundation of sustainable growth. However, data alone does not equal insight. Raw numbers, transaction logs, and support tickets are silent until interpreted through a structured framework. This is where customer journey mapping comes into play. It bridges the gap between quantitative data and qualitative design, transforming abstract metrics into a visual narrative of the human experience.
This guide provides a comprehensive, step-by-step approach to building a customer journey map. We will move from data collection to actionable design strategies, focusing on practical application rather than theoretical fluff. By following this process, organizations can identify friction points, optimize touchpoints, and align internal teams around a shared understanding of the customer.
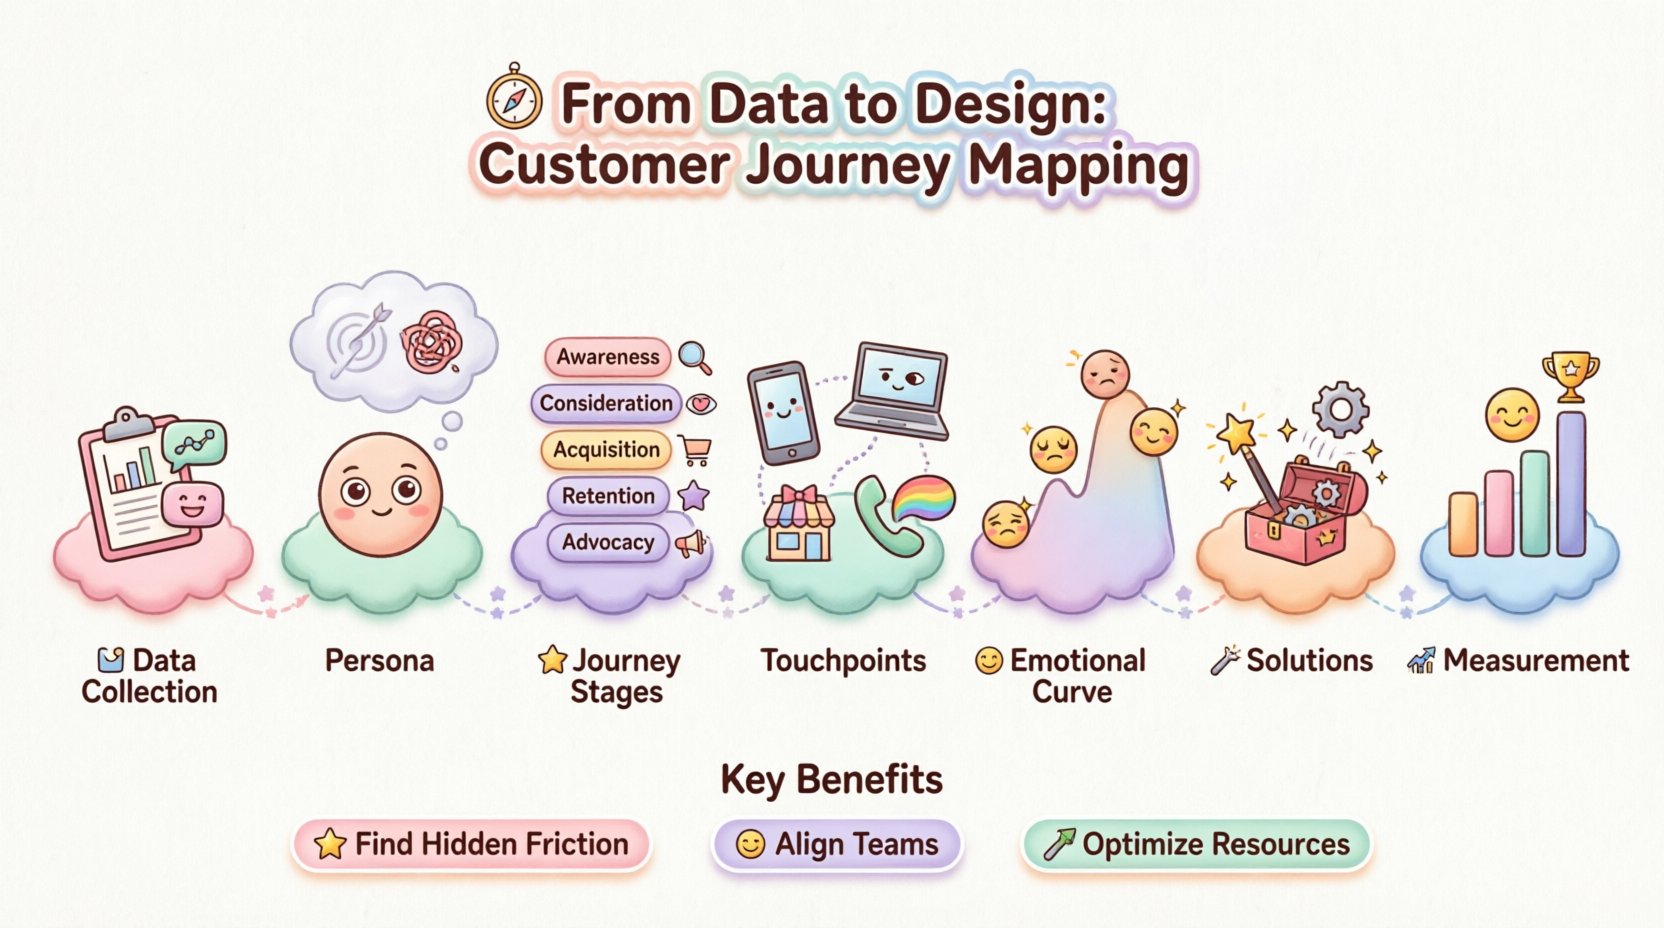
What is Customer Journey Mapping? 🧭
A customer journey map is a visual representation of every interaction a customer has with a brand. It is more than a flowchart; it is a story that traces the customer’s path from initial awareness to post-purchase advocacy. The map captures not just the actions taken, but the emotions, motivations, and barriers encountered along the way.
Unlike a service blueprint, which focuses on internal processes and backstage operations, the journey map centers exclusively on the user’s perspective. It answers critical questions:
- How does the customer find us?
- What are their expectations at each stage?
- Where do they encounter frustration?
- How does the emotional state shift throughout the process?
By visualizing these elements, teams can move beyond siloed thinking. Marketing, sales, support, and product development often operate with different definitions of success. A unified map creates a common language, ensuring that every department contributes to a seamless experience.
Why Invest Time in Journey Mapping? 📊
Creating a map requires significant effort, involving interviews, data analysis, and workshops. It is a resource-intensive process. However, the return on investment extends far beyond a single diagram. A well-executed mapping exercise delivers tangible strategic value.
1. Identifying Hidden Friction
Customers rarely complain about every issue they face. Some problems are so normalized that users simply abandon the process rather than report them. Mapping forces a granular review of the process, exposing gaps that analytics alone might miss. For example, a high drop-off rate on a checkout page might be visible in data, but the map reveals why—perhaps the shipping cost calculator appears too late in the flow.
2. Aligning Internal Stakeholders
Disagreements often stem from differing assumptions about the customer. One department may assume the customer values speed, while another assumes they value personalization. A map grounded in actual data resolves these conflicts by providing an objective reference point.
3. Optimizing Resource Allocation
Not all touchpoints hold equal weight. Some interactions drive loyalty, while others are merely administrative. Mapping helps prioritize investment. It is often more effective to fix one critical pain point than to improve ten minor ones. Resources can be directed toward high-impact areas identified through the map.
Phase 1: Gathering the Right Data 📥
The accuracy of the journey map depends entirely on the quality of the data used to build it. Relying on assumptions or internal opinions leads to a map that reflects what the company thinks happens, not what actually happens. A robust data strategy combines quantitative and qualitative sources.
Quantitative Sources
Numbers provide the skeleton of the journey. They show volume, velocity, and conversion rates. Key data points to collect include:
- Web Analytics: Traffic sources, bounce rates, session duration, and navigation paths.
- Transaction Logs: Purchase frequency, average order value, and return rates.
- Support Tickets: Common issues reported, resolution times, and contact reasons.
- CRM Data: Customer tenure, segment classification, and renewal history.
Qualitative Sources
Numbers explain the what, but qualitative data explains the why. These insights bring the map to life by adding emotional context.
- User Interviews: One-on-one conversations that explore motivations, goals, and frustrations in depth.
- Surveys: Broad feedback on satisfaction levels (e.g., Net Promoter Score) at specific stages.
- Observation: Watching users interact with the product or service in real-time to see unspoken behaviors.
- Feedback Loops: Comments from social media, reviews, and direct correspondence.
It is crucial to triangulate these sources. If analytics show a drop-off at a specific page, but interviews reveal confusion about a feature, the combination confirms the root cause.
Phase 2: Defining the Persona 👤
A journey map is not for everyone; it is for a specific type of customer. Trying to map the experience for an entire audience dilutes the insights. Instead, focus on a primary persona—a detailed representation of the ideal customer based on real data.
A persona should include:
- Demographics: Age, location, occupation, income level.
- Goals: What are they trying to achieve? (e.g., “Save time on tax filing” rather than “File taxes”).
- Pain Points: What obstacles currently stand in their way?
- Behavior Patterns: How do they typically research, buy, and use the product?
- Emotional Drivers: What fears or hopes influence their decisions?
When building the map, keep this persona in mind for every decision. Does this step make sense for them? Does it align with their goals? If the map addresses a generic audience, it will fail to resonate with the actual user.
Phase 3: Structuring the Journey Stages 🏗️
Once the data and persona are ready, the journey must be broken down into logical stages. These stages represent the phases of the relationship between the customer and the brand. While specific stages vary by industry, a standard framework often includes awareness, consideration, acquisition, retention, and advocacy.
The following table outlines common stages and their corresponding focus areas:
| Stage | Customer Goal | Key Question | Typical Touchpoints |
|---|---|---|---|
| Awareness | Discover a solution to a problem | “How do I find out about this?” | Social Media, Search, Ads, Word of Mouth |
| Consideration | Evaluate options and compare value | “Is this the right choice for me?” | Landing Pages, Reviews, Demos, Pricing |
| Acquisition | Make a purchase or sign up | “Can I complete the transaction easily?” | Checkout, Contract, Onboarding, Setup |
| Retention | Use the product and solve ongoing needs | “Does this continue to work for me?” | Support, Updates, Usage, Renewals |
| Advocacy | Recommend the brand to others | “Should I tell my friends?” | Referrals, Reviews, Social Shares |
Do not treat these stages as rigid walls. Customers may jump between them or loop back. The map should reflect the non-linear reality of the user experience. Use arrows and branching paths to indicate where users might diverge from the main flow.
Phase 4: Mapping Touchpoints and Channels 📱
Within each stage, list every interaction the customer has with the brand. This is the “touchpoint” layer. It is important to capture both digital and physical interactions.
When listing touchpoints, consider the following:
- Channels: Is the interaction happening online, in-app, over the phone, or in a physical store?
- Responsibility: Which team owns this interaction? (e.g., Marketing owns the ad, Support owns the call).
- Consistency: Is the messaging and tone consistent across channels?
A common failure point is the handoff between channels. A customer might start a conversation on chat and finish it over email. If the context is lost during this transition, the experience feels disjointed. The map should highlight where these handoffs occur and ensure data flows seamlessly between them.
Phase 5: Identifying Pain Points and Emotions 😣
This is the most critical part of the mapping process. It involves overlaying the emotional curve onto the structural journey. For each stage and touchpoint, ask: How does the customer feel?
Use an emotional scale to rate the sentiment at each point. Common emotions include:
- Confused
- Frustrated
- Excited
- Trusted
- Anxious
- Satisfied
Plot these emotions on a line graph beneath the journey stages. Peaks indicate moments of delight, while valleys indicate friction. The goal is to minimize the valleys and maximize the peaks.
Analyzing the Gaps
Look for the disconnects between what the customer expects and what they receive. This is often where the deepest insights lie.
- Expectation Mismatch: Did the marketing promise something the product couldn’t deliver?
- Process Barriers: Are there unnecessary steps that slow the user down?
- Information Gaps: Did the customer lack the information needed to make a decision?
- Technical Failures: Did the system crash or load slowly at a critical moment?
Document these issues explicitly. Assign them a priority based on impact and frequency. High-impact, high-frequency issues should be addressed first.
Phase 6: Designing Solutions and Service Blueprints 🛠️
Once the map highlights the problems, the next step is designing solutions. This often involves creating a service blueprint, which maps the internal processes required to support the customer journey.
A service blueprint adds two layers above the customer journey:
- Onstage Contact: Visible actions taken by employees or the system.
- Backstage Contact: Internal processes that support the customer but are not visible to them.
This ensures that when a customer sees a solution on the front end, the internal systems are capable of delivering it. For example, if the map shows a customer expecting instant refunds, the blueprint must ensure the finance system is automated to process those refunds immediately.
When designing solutions, focus on:
- Elimination: Remove steps that add no value.
- Automation: Use technology to handle repetitive tasks.
- Personalization: Tailor interactions based on customer data.
- Empowerment: Give support staff the tools to resolve issues without escalation.
Phase 7: Implementation and Measurement 📈
A map is a living document. Once the initial design changes are implemented, the work is not done. The new journey must be monitored to ensure it delivers the intended results.
Define Key Performance Indicators (KPIs) that align with the journey stages. Examples include:
- Awareness: Cost per acquisition, brand search volume.
- Consideration: Time on site, content engagement, demo requests.
- Acquisition: Conversion rate, cart abandonment rate.
- Retention: Churn rate, customer lifetime value, repeat purchase rate.
- Advocacy: Net Promoter Score, referral rate.
Set up a feedback loop. Regularly revisit the map with new data. Customer behaviors change, and so must the map. If a new feature launches or a competitor enters the market, the journey will shift. Schedule quarterly reviews to update the map and ensure it remains accurate.
Common Pitfalls to Avoid ⚠️
Even with a structured approach, organizations often stumble during the mapping process. Being aware of these common mistakes can save time and resources.
1. Mapping the Ideal vs. The Real
It is tempting to map how the company wants the customer to behave. This leads to a theoretical map that looks perfect on paper but fails in reality. Always ground the map in observed behavior, even if that behavior is messy or inefficient.
2. Ignoring Negative Experiences
It is easier to map the happy path where everything goes right. However, the most valuable insights often come from the broken paths. Where do people get stuck? Where do they give up? Focus heavily on these negative experiences.
3. Creating Too Many Maps
One map per persona is sufficient for most strategies. Creating maps for every segment can lead to analysis paralysis. Start with the primary persona, solve their problems, and then iterate for secondary segments.
4. Failing to Share the Map
If the map sits in a document folder, it has no value. It must be shared widely. Display it in meeting rooms, pin it to collaboration boards, and reference it in product roadmaps. The map should be the central artifact for decision-making.
5. Treating it as a One-Off Project
Journey mapping is not a project with an end date. It is a continuous discipline. The market changes, technology evolves, and customer expectations rise. A static map becomes obsolete quickly.
Conclusion: The Path Forward 🚀
Customer journey mapping is a powerful tool for aligning strategy with execution. It transforms abstract data into a human story, guiding design and operational decisions with clarity. By following this practical guide, teams can move from speculation to evidence-based design.
The journey from data to design is iterative. It requires humility to accept that assumptions are often wrong and the courage to change processes based on what is learned. When executed well, the result is not just a diagram, but a customer-centric culture where every decision prioritizes the user’s experience.
Start small. Gather the data. Build the map. Test the changes. Repeat. The path to better customer experience is paved with understanding, not intuition.

