


Ever feel like your marketing campaign is a chaotic jumble of ideas and deadlines? You’re not alone. The best Gantt chart builder can transform that chaos into a clear, visual roadmap, and Visual Paradigm‘s web-based tool is a powerful solution. This article will guide you through creating a professional timeline for a new product launch, using the tool’s intuitive interface. We’ll break down how to set up your project, define tasks, track progress, and generate a polished, shareable chart. By the end, you’ll have the confidence to plan any project, from a simple marketing push to a complex product development, with ease. This is not just about drawing a chart; it’s about visualizing your success.
Quick Summary: Your Gantt Chart Journey
-
Start with the basics: Define your project’s start and end dates in the Timeline Properties.
-
Build your task list: Use the interactive table to add tasks, assign developers, and set start/end dates.
-
See your plan come alive: The live preview updates in real-time as you input data.
-
Customize for clarity: Adjust the time unit (e.g., week) and column width to make your chart readable.
-
Export for action: Save your work locally and export a high-quality image for presentations.
Meet the Gantt Chart Builder: Your Project’s Visual Brain
Visual Paradigm’s Gantt Chart Builder is an online, web-based tool designed to make project planning effortless. It’s an easy-to-use Gantt chart maker that allows you to create, customize, and visualize project timelines with a simple, spreadsheet-like interface. The magic happens in two main sections: the Task Data table and the Live Preview chart. The first section is where you define the “what” and “when” of your project, while the second section is where you see the “how” and “when” visualized in a dynamic bar chart. This separation ensures you can focus on data entry without losing sight of the big picture.
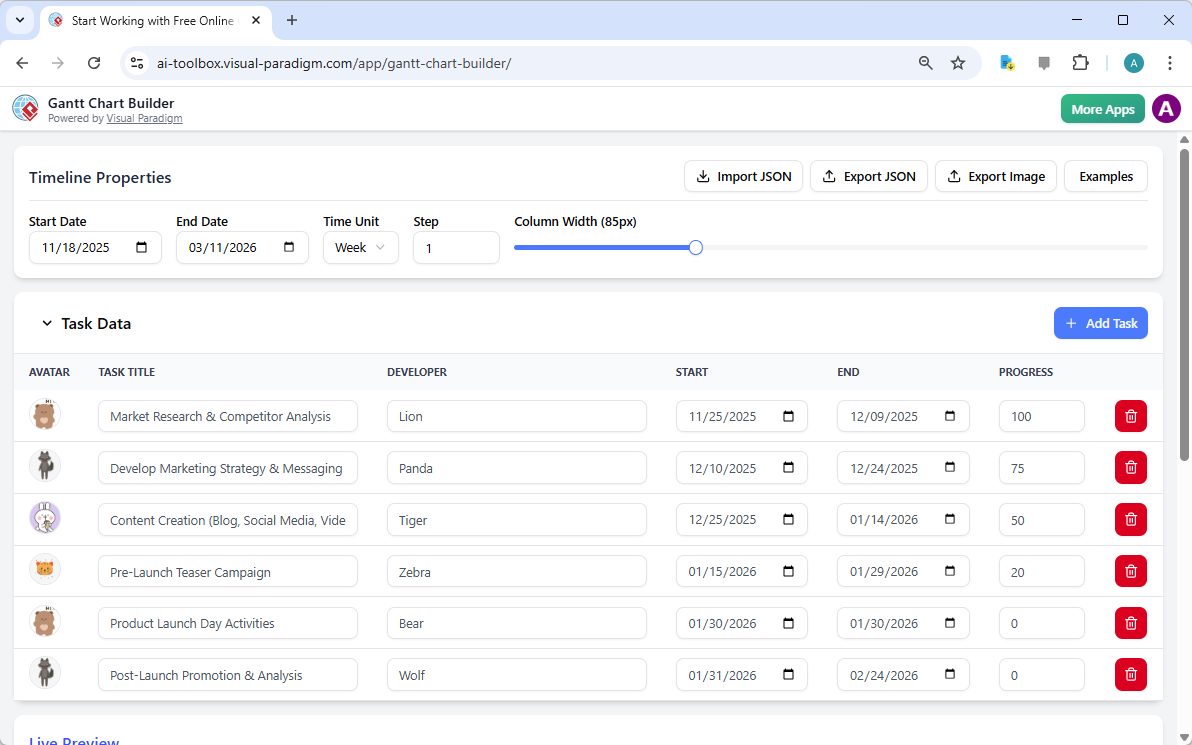
Understanding the interface is key. The top section, as shown in Image 1, is the “Timeline Properties” area. This is where you set the overall parameters for your chart, such as the start and end dates of the entire project. You can also choose the “Time Unit” (e.g., day, week, month) and adjust the “Step” and “Column Width” to control the level of detail. This is your command center for scaling the timeline to fit your project’s scope.
Building Your Project: From Task List to Timeline
Let’s dive into the core workflow. The heart of the Gantt Chart Builder is the “Task Data” table, visible in Image 1. This is where you’ll define each individual task for your marketing campaign. The process is straightforward: simply click the “+ Add Task” button to create a new row. For each task, you’ll fill in the “Task Title” (e.g., “Market Research”), assign a “Developer” (with a fun avatar!), and set the “Start” and “End” dates. You can also track progress with a percentage, which is incredibly useful for ongoing projects.
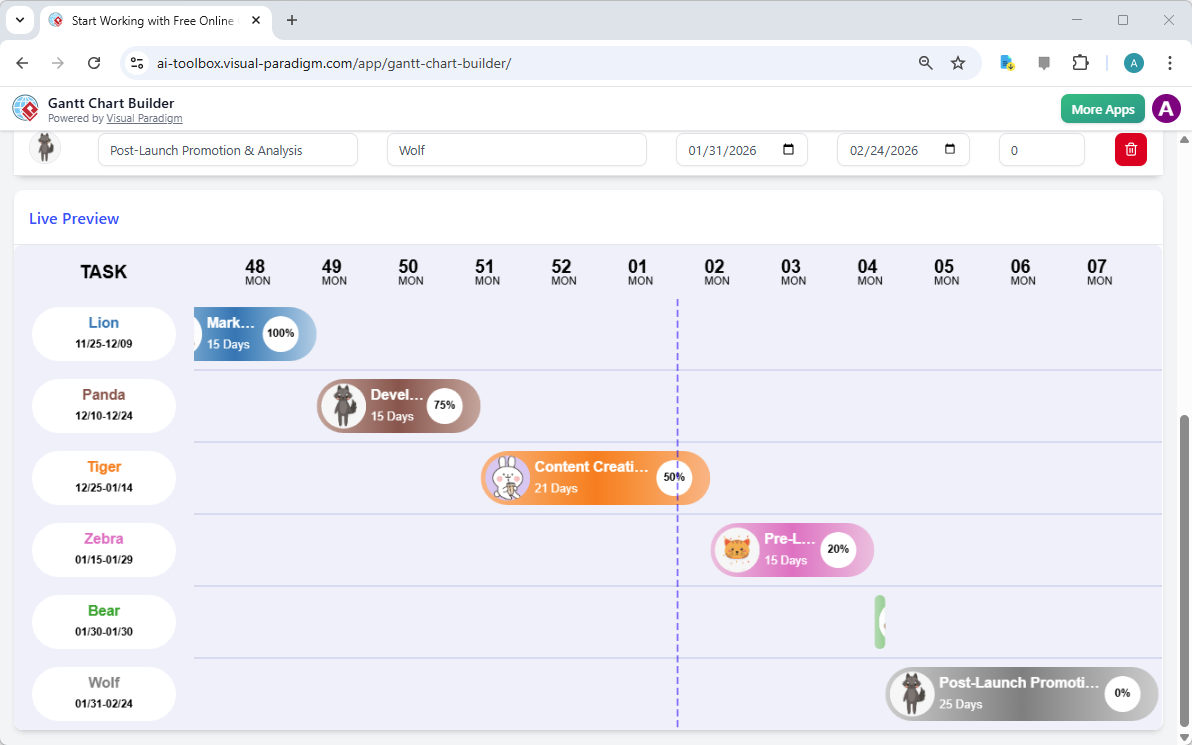
As you enter this information, the magic happens. The “Live Preview” section, shown in Image 2, updates instantly. Each task you add appears as a colored bar on the timeline, with its length reflecting its duration. The chart automatically scales to fit your defined timeline, so you can see at a glance if tasks overlap, if there are gaps, or if your project is on track. This real-time feedback is a game-changer for planning.
Customizing Your View: Making Your Timeline Readable
Not all projects are created equal. A one-size-fits-all chart won’t work for a 6-month product launch or a 2-week marketing sprint. The Gantt Chart Builder gives you the power to customize the view. In the “Timeline Properties” section, you can change the “Time Unit” from “Week” to “Month” or “Day” to match the scale of your project. For instance, if your campaign is a year long, switching to a “Year” unit might be more effective than a “Week” unit, which would be too granular.
Additionally, you can adjust the “Step” to control the interval (e.g., 1 week, 2 months) and the “Column Width” to make the chart more compact or spread out. This is crucial for readability. A wide column width can help you see more detail, while a narrower one is better for a high-level overview. The live preview ensures you can see the impact of these changes instantly, allowing you to fine-tune the chart until it perfectly represents your project.
Finalizing and Sharing Your Plan
Once your project plan is complete, it’s time to save and share it. The Gantt Chart Builder prioritizes your privacy and control. All your project data is saved locally as a JSON file, so you can import and export it securely without needing to sign up for an account. This means your sensitive project plans are never uploaded to a cloud server.
To share your work, use the “Export Image” button. This will generate a high-quality PNG or JPEG of your Gantt chart, perfect for presentations, reports, or sharing with stakeholders. This image is a powerful communication tool, instantly conveying the project’s scope, timeline, and progress. For data backup or integration with other systems, you can also export the raw project data as a JSON file.
With the Gantt Chart Builder, you’re not just creating a chart; you’re creating a visual narrative of your project’s journey. It turns abstract ideas into a concrete plan, fosters better team alignment, and gives you the confidence to manage complex projects with clarity and precision.
Start Your Project Today
Ready to transform your project planning? The best Gantt chart builder is just a click away. Try the Visual Paradigm Gantt Chart Builder now and see how it can help you create a clear, visual roadmap for your next marketing campaign or any project you’re passionate about. Start Working with Free Online and unlock your project’s full potential.
Related Links
Gantt charts are essential project management tools used to plan, visualize, and track project timelines by scheduling tasks and managing dependencies. Modern solutions integrate AI-driven automation for instant scheduling and cloud-based platforms for real-time team collaboration across various industries.
-
Practical Guide to Gantt Charts: Master Project Planning & Scheduling: A comprehensive resource for understanding the benefits, effective construction, and best practices of using charts for management.
-
AI-Powered Gantt Chart Builder – Instant Project Planning Tool: This tool leverages artificial intelligence to generate complete Gantt charts instantly from simple task inputs.
-
Visual Paradigm Gantt Chart Tool – Create & Manage Project Timelines: A professional toolset designed to help users plan and track project progress efficiently through a visual interface.
-
Online Gantt Chart Tool – Real-Time Collaboration & Project Planning: A cloud-based solution that allows distributed teams to collaborate in real time on task scheduling and management.
-
Gantt Chart Builder – Build Custom Project Timelines Easily: This feature enables the creation of dynamic, interactive schedules using intuitive drag-and-drop functionality.
-
Free Gantt Chart Templates – Ready-to-Use Project Planning Tools: Access a library of downloadable and customizable templates to jumpstart project planning with minimal setup.
-
Explore Gantt Chart Maker – Create Professional Charts Online: An overview of an online platform for building professional charts with advanced tracking and collaboration features.
-
Gantt Chart Templates – Customize & Use for Any Project: A versatile collection of templates tailored for various industries and project types in an online library.
-
How to Use Visual Paradigm Gantt Chart Tool – Video Tutorial: A step-by-step video guide walking users through the process of creating and managing projects using the software.
-
Timeline Diagram Software for Visual Planning: A specialized tool for creating interactive timelines to manage project milestones, deadlines, and schedules effectively.
