


Customer journey mapping has traditionally been viewed as a strategic marketing asset. Organizations create beautiful visuals to align teams on the ideal customer experience. However, this perspective often overlooks the map’s true potential as a diagnostic instrument. When treated correctly, a journey map functions like a medical diagnostic tool for a business. It does not simply show where a customer goes; it reveals where the experience breaks down.
Friction is rarely obvious in the beginning stages. It hides within micro-interactions, policy conflicts, and emotional disconnects. To find these hidden points, you must shift from a descriptive approach to a diagnostic one. This guide explores how to leverage journey mapping to identify, analyze, and resolve the invisible barriers that degrade customer satisfaction and retention.
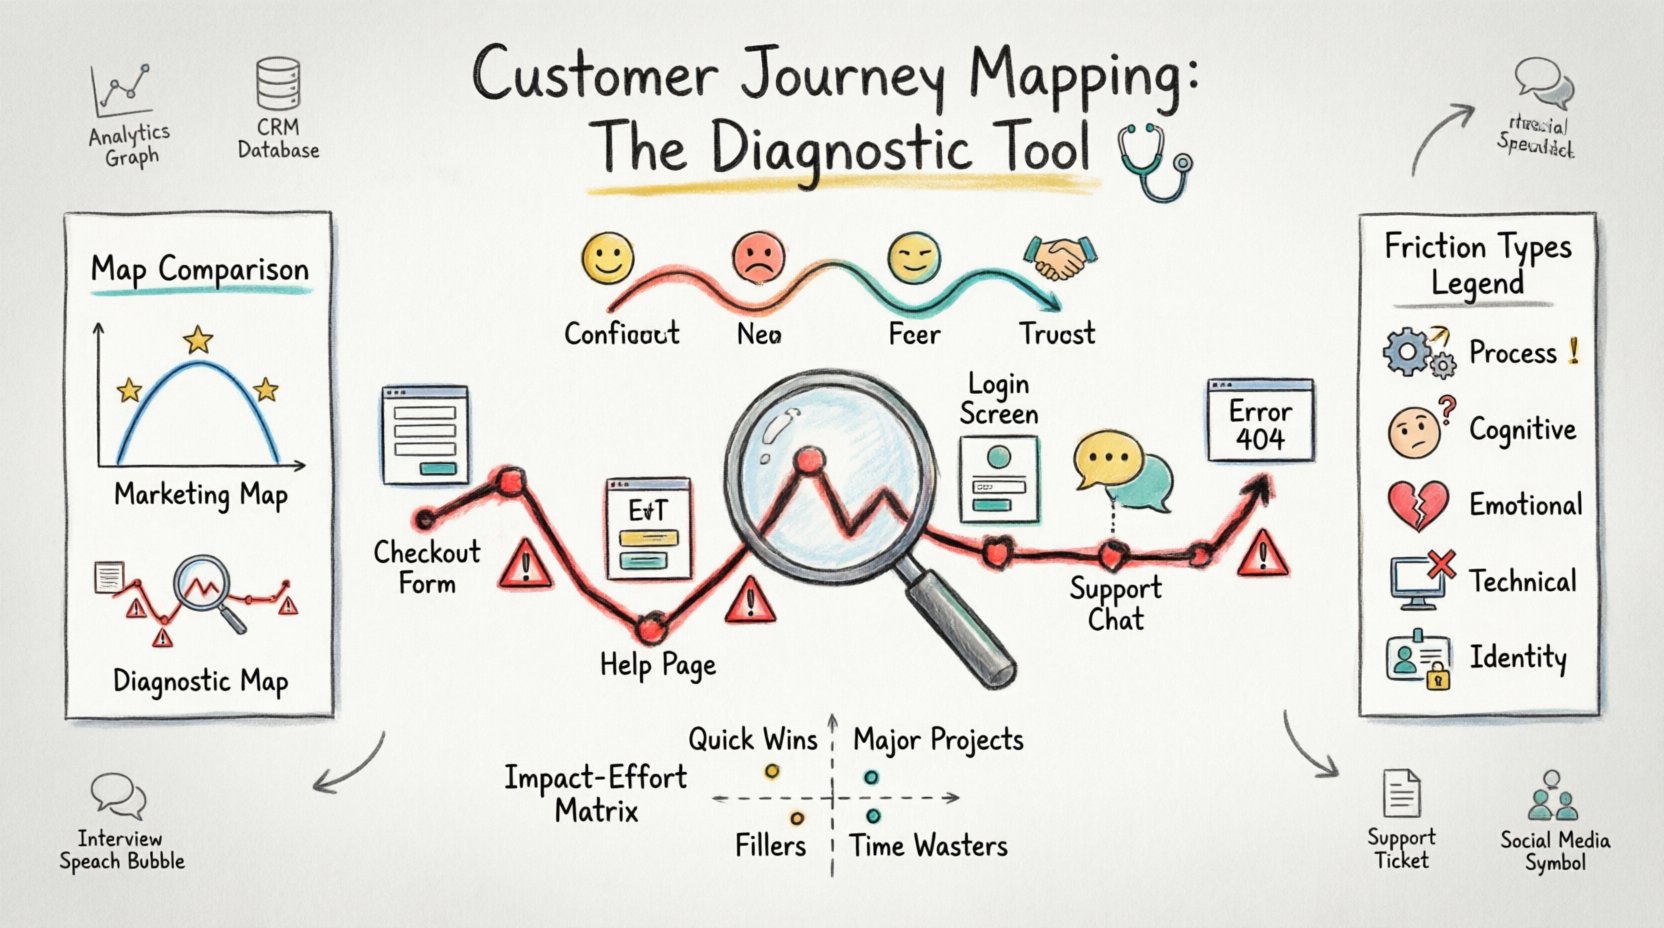
The Shift from Marketing Asset to Diagnostic Instrument 🔄
Most organizations build journey maps that depict the “Happy Path.” This is the theoretical ideal scenario where every step works perfectly. While useful for brand alignment, the Happy Path fails to expose the reality of customer interaction. A diagnostic map prioritizes the “Unhappy Path.” It focuses on moments of failure, confusion, and effort.
To transition from marketing to diagnostics, consider the following distinctions:
- Scope: Marketing maps focus on awareness and conversion. Diagnostic maps focus on retention and support.
- Data Source: Marketing maps rely on assumptions and high-level metrics. Diagnostic maps rely on behavioral data, call logs, and direct feedback.
- Goal: Marketing maps aim to inspire. Diagnostic maps aim to identify root causes.
- Update Frequency: Marketing maps are static annual documents. Diagnostic maps are living artifacts updated by every support ticket or churn event.
By adopting a diagnostic mindset, you stop asking “How do we sell more?” and start asking “Why are they struggling?” This shift requires a deeper commitment to truth over optimism.
Understanding the Layers of Friction 🔍
Friction is not a monolith. It manifests in different ways depending on the nature of the interaction. A diagnostic map must categorize these friction points to determine the correct solution. Friction can be physical, digital, cognitive, or emotional.
Use the table below to categorize the types of friction you might encounter during a diagnostic review.
| Friction Type | Description | Example Indicator |
|---|---|---|
| Process Friction | Excessive steps or bureaucratic hurdles required to complete a task. | High drop-off at checkout form step 4. |
| Cognitive Friction | Confusion regarding what to do next or what a term means. | Repeated returns to help pages or FAQ sections. |
| Emotional Friction | Negative feelings triggered by tone, wait times, or perceived disrespect. | Customer sentiment analysis shows frustration keywords. |
| Technical Friction | System errors, slow load times, or compatibility issues. | Browser error logs or session timeout warnings. |
| Identity Friction | Customers feel like they must re-verify themselves unnecessarily. | Multiple login requests for the same session. |
When mapping the journey, mark every instance of these friction types. Do not smooth them over. Highlight them in red. A diagnostic map is useless if it looks like the marketing map. The value lies in the jagged lines, not the smooth curves.
The Diagnostic Mapping Process 🛠️
Creating a diagnostic journey map requires a structured methodology. It is not enough to sketch a timeline. You must validate every step against reality. Follow this process to ensure accuracy.
1. Define the Specific Customer Persona
A generic customer profile leads to generic findings. A diagnostic map needs specific context. Are you mapping the journey of a first-time buyer or a long-term enterprise client? Their pain points differ significantly.
- Segment by Behavior: Group users by how they use the product, not just demographics.
- Segment by Need: Focus on users who have already encountered a problem. Their journey is the one that needs diagnosing.
2. Gather Evidence, Not Opinions
Stakeholder opinions are often biased by internal success stories. You need evidence from the field. Collect data from the following sources:
- Customer Support Logs: Analyze transcripts for recurring complaints at specific touchpoints.
- Session Recordings: Watch users struggle with navigation or forms in real-time.
- Survey Responses: Look for Net Promoter Score (NPS) detractors and read their open-ended comments.
- Analytics Heatmaps: Identify where users click furiously (rage clicks) or scroll away quickly.
3. Map the Emotional Arc
A journey is not just a list of actions; it is a sequence of emotions. Plot the emotional trajectory alongside the action steps. Ask customers how they felt at each stage.
- Confidence: Do they feel in control?
- Relief: Did a problem get solved?
- Frustration: Where did they feel stuck?
- Trust: Did the interaction build credibility or erode it?
4. Identify the “Moments of Truth”
Not all steps in a journey are equal. Some moments define the entire relationship. These are the moments of truth. In a diagnostic map, these are the critical checkpoints where friction causes the highest damage.
For example, in a software subscription, the “Trial to Paid” conversion is a moment of truth. If friction exists here, the entire business model suffers. In a service business, the “First Interaction” is the moment of truth. If the greeting is cold or the wait time is long, the customer leaves before the service even begins.
Data Sources That Reveal the Truth 📊
Reliable diagnosis requires reliable data. Relying on a single source creates blind spots. Cross-reference quantitative data (numbers) with qualitative data (stories). The intersection of these two often reveals the root cause of friction.
| Data Source | What It Reveals | Diagnostic Application |
|---|---|---|
| Web Analytics | Behavioral patterns and drop-off rates. | Identify specific pages where users abandon the process. |
| CRM Logs | Interaction history and sales cycle length. | Spot delays in communication or stalled deals. |
| Customer Interviews | Deep motivations and emotional drivers. | Understand *why* a user hesitated at a specific step. |
| Support Tickets | Recurring technical or process issues. | Quantify the frequency of specific errors. |
| Social Listening | Public sentiment and brand perception. | Monitor unfiltered customer complaints on public channels. |
When analyzing these sources, look for patterns. A single complaint is an anomaly. Ten complaints about the same checkout button is a design failure. Ten complaints about the same policy is a strategic failure.
Identifying the Invisible Barriers 🕵️
Some friction points are invisible because they are normalized. Customers accept them as part of the industry standard. A diagnostic map helps surface these normalized inefficiencies.
1. The Burden of Memory
Does the customer have to remember information from a previous step to complete the current one? If they must recall an order number, a date, or a specific code, you are imposing cognitive load. A friction-free experience provides this information automatically.
2. The Gap Between Channels
Customers often switch channels. They browse online, call support, and then visit a store. If the context does not transfer between these channels, friction spikes. This is known as “channel siloing.” The customer must repeat their story every time they switch mediums.
3. The Policy vs. Human Conflict
Employees often have to enforce policies that contradict customer needs. If a frontline worker says, “I know you’re right, but the system won’t let me,” that is a massive friction point. The friction is not the customer; it is the rigid system protecting the company.
4. The Silence of the Void
What happens after a customer takes an action? If they submit a request and hear nothing, anxiety rises. This “black box” phase creates emotional friction. Customers need confirmation, status updates, or estimated timelines. Silence is interpreted as inaction.
Validating Your Findings 🔬
Once you have identified potential friction points on the map, you must validate them before implementing changes. Assumptions lead to wasted resources. Validation ensures you fix the right problems.
- Quantitative Validation: Check if the friction point correlates with a drop in conversion or a rise in churn. Does fixing Step 3 actually improve retention metrics?
- Qualitative Validation: Conduct usability testing. Ask a group of users to perform the task while observing where they hesitate. Do not ask them if it is hard; watch them struggle.
- A/B Testing: If possible, test the friction removal against the original process. Measure the difference in completion rates.
Validation also involves checking the impact on other departments. Fixing a friction point for the customer might create a new burden for the support team. A holistic diagnostic approach considers the internal cost as well as the external benefit.
Prioritizing Fixes Based on Impact 📉
You will likely find many friction points. You cannot fix them all at once. Prioritization is a critical part of the diagnostic process. Use an impact-effort matrix to decide what to address first.
- High Impact, Low Effort: These are “Quick Wins.” Fix them immediately. They offer the fastest return on investment.
- High Impact, High Effort: These are “Major Projects.” Plan these strategically. They require significant resources but yield high rewards.
- Low Impact, Low Effort: These are “Fillers.” Do them only if you have spare capacity.
- Low Impact, High Effort: These are “Time Wasters.” Avoid these. They drain resources without improving the customer experience.
Focus on the friction that costs the most money or damages the most relationships. For example, friction that prevents a subscription renewal is more critical than friction that makes a newsletter signup slightly slower.
Monitoring the Long-Term Shift 📈
The work does not end when the map is updated. Friction evolves. Customer expectations change. Technology shifts. A diagnostic map is a baseline, not a destination.
To maintain diagnostic accuracy:
- Set Review Cycles: Revisit the map quarterly or biannually. Old friction points may have been solved, but new ones may have emerged.
- Track Leading Indicators: Don’t wait for churn to fix issues. Monitor support ticket volume, session duration, and task completion time as leading indicators of friction.
- Empower Frontline Staff: The people interacting with customers daily often know where the friction is before the data does. Create a feedback loop where they can update the map directly.
Continuous improvement is the only way to keep the map relevant. If the map is static, it is no longer a diagnostic tool; it is a historical record.
Common Pitfalls in Diagnostic Mapping ⚠️
Even with the best intentions, teams often make mistakes that reduce the value of the diagnostic process. Avoid these common traps.
- Ignoring the Backstage: You cannot map the customer journey without understanding the internal processes that support it. If the backend is broken, the frontend will always have friction.
- Focusing on the Brand: Do not prioritize brand aesthetics over functional utility. A beautiful website that does not work is a failure of diagnostics.
- Assuming Linearity: Customer journeys are rarely linear. They loop, restart, and branch. A linear map misses the complexity of real behavior.
- Over-Optimizing: Do not try to make every step perfect. Some friction is necessary for security or compliance. Identify where friction is *unnecessary*, not where it is *required*.
Conclusion on Diagnostic Integrity
Using customer journey mapping as a diagnostic tool changes the conversation from “How do we look?” to “How does it work?” It requires honesty, data, and a willingness to look at the uncomfortable parts of the business.
When you successfully identify hidden friction points, you do more than improve a metric. You reduce the cognitive load on your customers. You build trust. You create a system that respects the user’s time and effort. This is the core function of a diagnostic map: to reveal the path that is currently obstructed and to clear the way for a smoother experience.
Start by auditing your current maps. If they look too smooth, add more data. If they are too optimistic, introduce reality. The goal is not perfection, but clarity. Clarity is the first step toward improvement.