


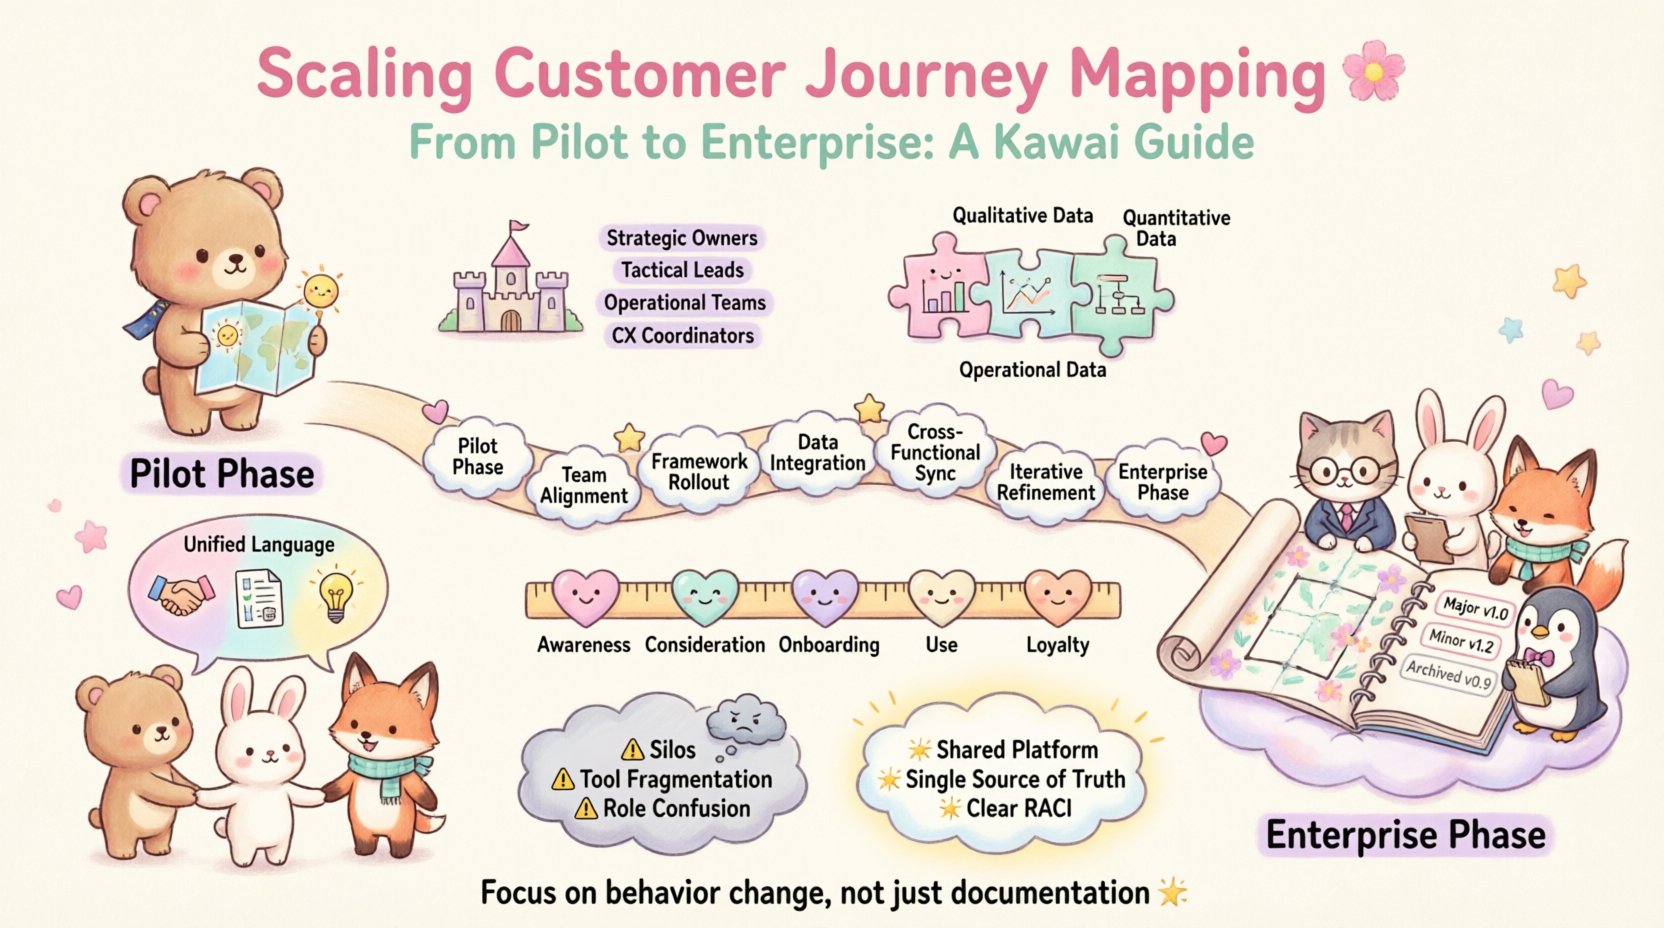
Moving from a single project pilot to a company-wide strategy requires a fundamental shift in mindset. Customer journey mapping often starts as a creative workshop, but to succeed at scale, it must become a disciplined operational process. This guide outlines the structural changes needed to expand your initiatives without losing the human-centric focus that made them successful initially.
Understanding the Shift from Pilot to Enterprise 📈
Pilot projects thrive on agility and enthusiasm. A small team can iterate quickly, relying on direct communication and ad-hoc data sources. However, enterprise scaling introduces complexity. Departments have different KPIs, data silos become more pronounced, and the number of stakeholders increases exponentially. The goal is not to standardize every touchpoint rigidly, but to create a governance framework that supports consistency while allowing for local adaptation.
Here are the core differences you will encounter:
- Pilot Phase: Focused on discovery, high-level empathy, and identifying quick wins.
- Enterprise Phase: Focused on integration, measurement, and sustained operational change.
- Scope: Expands from a single channel (e.g., mobile app) to omnichannel ecosystems.
- Ownership: Shifts from a single CX lead to cross-functional steering committees.
Recognizing these distinctions early prevents the common pitfall of trying to force enterprise-level rigor onto a small team before the foundation is ready.
Establishing Governance Frameworks 🏛️
Without governance, journey maps become outdated artifacts gathering dust. To scale, you need a clear structure for who owns the maps, how often they are updated, and how they influence decision-making.
1. Define Roles and Responsibilities
Assigning ownership is critical. In a pilot, one person might own the map. In an enterprise, you need a tiered approach:
- Strategic Owners: C-level executives who approve the vision and budget.
- Tactical Leads: Department heads responsible for specific journeys (e.g., Head of Product for Onboarding Journey).
- Operational Teams: Frontline staff who execute the experience and provide feedback on friction points.
- CX Coordinators: Individuals dedicated to maintaining the repository of maps and ensuring version control.
2. Create a Centralized Repository
Maps should be accessible, not siloed in personal drives. Establish a single source of truth where all journey maps are stored. This repository should include:
- Current state maps and future state targets.
- Version history to track changes over time.
- Linked data sources that inform the map.
- Action items with owners and due dates.
Data Integration & Truth Sources 📊
A journey map is only as good as the data backing it. In a pilot, you might rely on interviews and surveys. At scale, you must integrate quantitative data from multiple systems to validate qualitative insights.
Connecting the Data Silos
Customer data often lives in disconnected systems. Sales data, support tickets, and product usage logs rarely speak to each other natively. To scale your mapping, you must align these data streams.
- Identify Key Systems: List every system that touches customer data (CRM, Helpdesk, Analytics, Billing).
- Define Common IDs: Ensure there is a way to link a customer across these systems, such as a unified user ID or email hash.
- Automate Data Feeds: Where possible, set up automated reporting to update journey metrics regularly without manual entry.
Measuring Friction and Flow
Qualitative maps show where the customer feels. Quantitative data shows where the customer fails. Combine these to get a full picture.
| Data Type | Purpose | Examples |
|---|---|---|
| Qualitative | Understand feelings, motivations, and context. | Interviews, Usability Tests, NPS Comments |
| Quantitative | Measure volume, time, and success rates. | Conversion Rates, Task Completion Time, Abandonment Rates |
| Operational | Track internal performance during the journey. | Agent Handle Time, Ticket Volume, API Latency |
When scaling, prioritize the data points that directly impact the business goal of the journey. Do not collect everything; collect what matters.
Cross-Functional Alignment 🤝
The biggest hurdle in enterprise scaling is organizational alignment. Different departments often optimize for their own metrics, which can conflict with the customer journey.
Breaking Down Silos
Marketing wants to drive traffic. Support wants to reduce ticket volume. Product wants to increase feature adoption. These goals are not inherently bad, but they can create friction if not aligned under the customer journey umbrella.
- Shared Workshops: Bring representatives from all departments to map the journey together. This builds empathy across teams.
- Unified Language: Ensure everyone uses the same terminology for touchpoints. Avoid using different names for the same process in different departments.
- Joint KPIs: Create metrics that require collaboration to improve. For example, a metric that measures both conversion (Marketing) and first-contact resolution (Support).
The Feedback Loop
Scaling requires a mechanism to feed real-world experiences back into the maps. Frontline employees are often the first to know when a process breaks.
- Regular Review Cycles: Schedule quarterly reviews where teams discuss map validity.
- Incident Reporting: Allow teams to flag specific journey touchpoints when they break due to system updates or policy changes.
- Customer Voice: Integrate direct customer feedback into the review process, not just internal opinions.
Iterative Maintenance and Updates 🔄
A journey map is a living document, not a poster to hang on a wall. As your product evolves, the journey evolves. At scale, you need a process for versioning and archiving.
Version Control Strategy
Just like software code, journey maps need version control.
- Major Versions: Released when the core journey flow changes significantly (e.g., new product launch).
- Minor Versions: Released for incremental improvements or data updates.
- Archived Versions: Kept for historical reference and trend analysis.
Triggers for Updates
Don’t wait for an annual review to update your maps. Use specific triggers to initiate updates:
- System Changes: New technology or platform migration.
- Policy Shifts: Changes in compliance, pricing, or return policies.
- Customer Feedback Trends: A spike in complaints or praise regarding a specific stage.
- Competitor Moves: When a competitor launches a feature that changes industry expectations.
Measuring Success and Impact 📏
Executives need to see the ROI of journey mapping efforts. You must link the mapping activity to tangible business outcomes.
Leading vs. Lagging Indicators
Use a mix of indicators to prove value.
- Lagging Indicators: Metrics that reflect past performance (e.g., Churn Rate, Total Revenue).
- Leading Indicators: Metrics that predict future performance (e.g., Intent Scores, Engagement Frequency).
Common Metrics for Journey Maps
| Journey Stage | Primary Metric | Secondary Metric |
|---|---|---|
| Awareness | Cost Per Acquisition | Brand Search Volume |
| Consideration | Conversion Rate | Time to Decision |
| Onboarding | Activation Rate | Time to Value |
| Retail/Use | Retention Rate | Support Ticket Volume |
| Loyalty | Net Promoter Score | Referral Rate |
Common Obstacles and Solutions ⚠️
As you expand, you will face resistance. Here is a breakdown of common issues and practical ways to handle them.
- Problem: Stakeholders say the maps are not accurate.
Solution: Validate with recent data before presenting. Invite stakeholders to the validation session. - Problem: Teams ignore the maps in daily work.
Solution: Embed journey checklists into existing workflows and project management tools. - Problem: Data is inconsistent across regions.
Solution: Allow for regional variations in the map structure while keeping the core journey logic consistent. - Problem: Lack of resources to maintain maps.
Solution: Automate data collection and assign specific ownership for maintenance to prevent burnout.
Final Thoughts on Scaling 🌟
Scaling customer journey mapping is less about the visual design and more about the operational discipline behind it. It requires a balance between structure and flexibility. By establishing clear governance, integrating data sources, aligning cross-functional teams, and maintaining a rigorous update schedule, you can turn a pilot project into a lasting strategic asset.
The journey does not end with the map. It ends when the insights from the map drive real changes in how the organization operates. Focus on the behavior change, not just the document creation.

