


Customer experience is no longer just a departmental goal; it is a strategic business imperative. Yet, when you present a plan to map customer journeys, you often face a familiar challenge: the request for budget, time, and resources triggers immediate questions about return on investment. Stakeholders need proof that mapping the customer path will yield tangible financial or operational results. This guide details how to structure your argument, measure impact, and demonstrate value from the outset.
The path from mapping to monetization is not always linear. Many teams get stuck in the analysis phase without connecting their findings to the bottom line. To secure buy-in, you must shift the conversation from abstract customer feelings to concrete business outcomes. By focusing on specific metrics and aligning them with organizational goals, you can build a compelling case for journey mapping work.
Understanding the Skepticism Barrier 🛑
Before diving into metrics, it helps to understand why stakeholders hesitate. In many organizations, CX initiatives are viewed as “soft” costs. Unlike a sales campaign where a dollar spent generates a predictable return, journey mapping feels like research. It requires resources to conduct interviews, analyze data, and design prototypes, but the payoff seems distant.
To overcome this, you must reframe the narrative. You are not just mapping a journey; you are identifying revenue leakage points, reducing operational friction, and increasing customer lifetime value. When you speak the language of finance and operations, the conversation changes from “Do we need this?” to “How quickly can we implement this?”
Here are the common concerns you will face and how to address them:
- Cost vs. Value: Stakeholders worry about the upfront cost of data collection. Response: Highlight the cost of inaction, such as lost customers or support ticket volume.
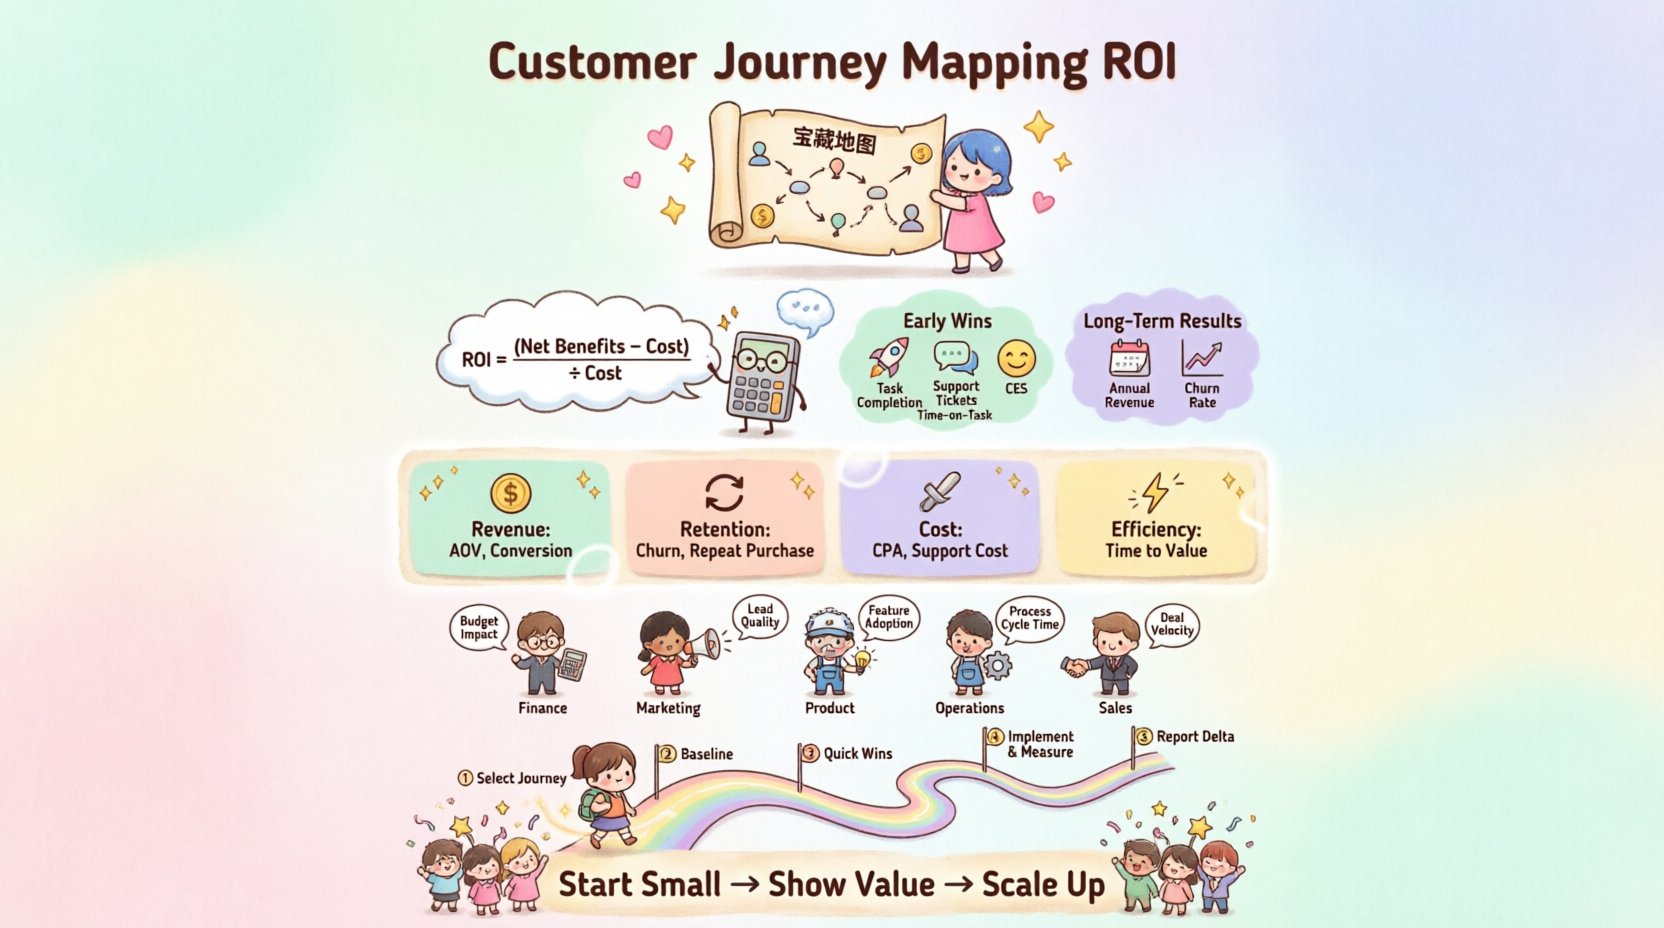
- Timeline: They ask when the money comes back. Response: Distinguish between leading indicators (early wins) and lagging indicators (long-term revenue).
- Complexity: They fear the process is too complicated. Response: Show a phased approach that delivers value in small increments.
Defining ROI in the Context of CX 💰
Return on investment in customer experience is calculated differently than in traditional marketing. Traditional ROI often looks at immediate conversion. CX ROI often involves retention, efficiency, and advocacy. It is crucial to define your metrics clearly before starting the work.
A comprehensive approach combines quantitative data (numbers) with qualitative data (insights). You cannot rely on one or the other. Numbers tell you what is happening, while insights tell you why.
The ROI Equation for Journey Mapping
While there is no single universal formula, the core logic remains consistent across industries. You are looking at the difference between the value gained and the cost of the initiative.
Basic Formula:
ROI = (Net Benefits – Cost of Investment) / Cost of Investment
However, in journey mapping, “Net Benefits” can be tricky to isolate. This is where early indicators become vital. You need to identify proxy metrics that correlate strongly with financial performance. For example, if you map the onboarding journey and find a specific friction point, fixing it might reduce churn. You can then calculate the monetary value of retaining those customers.
Leading vs. Lagging Indicators ⏳
One of the biggest mistakes teams make is waiting for lagging indicators to prove value. Lagging indicators, like annual revenue or total churn rate, take time to change. By the time they shift, stakeholders may have lost interest. You need leading indicators that show progress early in the mapping process.
Leading indicators act as early warning systems or progress markers. They validate that the journey changes you are implementing are having an effect before the full fiscal quarter closes.
Leading Indicators to Track
- Task Completion Rates: How many users finish a specific step in the journey? (e.g., account setup, checkout).
- Support Ticket Volume: Does a specific journey change reduce the number of incoming queries?
- Time-on-Task: Are users completing tasks faster after improvements?
- Customer Effort Score (CES): How easy is it for the customer to achieve their goal?
- Adoption Rates: Are new features or processes being used as intended?
Tracking these metrics allows you to report progress monthly, not annually. This creates a rhythm of accountability and keeps stakeholders engaged throughout the project lifecycle.
Quantitative Metrics That Matter 📈
When presenting to a finance or executive audience, numbers are the currency of trust. You must select metrics that directly influence the P&L (Profit and Loss) statement. The goal is to show how journey optimization impacts revenue, costs, or risk.
Below is a table of key quantitative metrics categorized by their business impact.
| Category | Metric | Why It Matters |
|---|---|---|
| Revenue | Average Order Value (AOV) | Indicates if the journey encourages upselling or cross-selling. |
| Revenue | Conversion Rate | Measures the efficiency of the path from interest to purchase. |
| Retention | Churn Rate | Directly impacts long-term customer value and revenue stability. |
| Retention | Repeat Purchase Rate | Shows loyalty and satisfaction with the post-purchase experience. |
| Cost | Cost Per Acquisition (CPA) | Shows if the journey makes marketing spend more efficient. |
| Cost | Cost Per Contact (Support) | Reducing friction lowers the cost of servicing customers. |
| Efficiency | Time to Value | How fast does the customer realize the benefit of your product? |
| Risk | Compliance Errors | Crucial for regulated industries where journey errors cause fines. |
When you present these, do not just list the current numbers. Show the projected improvement. For instance, “If we reduce friction in the checkout flow by 10%, and our current conversion is 2%, we project a 5% increase in total revenue.” This projection is the bridge between mapping and money.
Qualitative Insights & Sentiment 🗣️
Numbers tell you where the problem is, but they rarely tell you the human reason behind it. Qualitative data provides the narrative that makes the numbers believable. When stakeholders see a drop in conversion, they want to know the story.
Journey mapping is uniquely positioned to capture this. Through interviews, observations, and feedback collection, you can document the emotional journey alongside the transactional one.
Key qualitative metrics to capture include:
- Pain Point Frequency: How often do users express frustration at a specific step?
- Emotional Triggers: When does the customer feel anxious, excited, or confused?
- Unmet Expectations: Where does the experience fail to meet the promise made by marketing?
- Language Usage: What words do customers use to describe their experience? (Use this in your internal reports to show you understand their voice).
Combining these insights with the quantitative data creates a powerful narrative. For example, “Support tickets spiked by 15% (Quantitative) because users found the new login process confusing (Qualitative).” This combination justifies the investment in fixing the login flow.
Aligning with Business Goals 🎯
Customer journey mapping cannot exist in a vacuum. It must align with the broader strategic objectives of the organization. If the company goal is market expansion, your journey map should focus on acquisition and onboarding. If the goal is profitability, focus on retention and cost-to-serve.
Stakeholders from different departments care about different things. To get broad support, you must tailor your value proposition to each group.
Department-Specific Value
- Finance: Focus on cost reduction, margin improvement, and revenue attribution.
- Marketing: Focus on acquisition efficiency, brand perception, and conversion.
- Product: Focus on feature adoption, usability, and defect reduction.
- Operations: Focus on process efficiency, error reduction, and support load.
- Sales: Focus on lead quality, sales cycle length, and close rates.
When you create your business case, create a section for each department. Show them exactly how their specific pain points are addressed by the journey mapping initiative. This turns the project from an “IT request” into a “company-wide initiative.”
Connecting CX to P&L 🧮
The most effective way to prove value is to link customer experience directly to the Profit and Loss statement. You need to translate experience improvements into financial terms. This requires a bit of financial modeling, but the effort pays off in credibility.
The Customer Lifetime Value (CLV) Link
One of the strongest arguments for journey mapping is its impact on CLV. Every improvement in the journey that prevents churn increases the lifetime value of that customer.
Step 1: Identify the Friction. Find a specific point in the journey where customers leave or complain.
Step 2: Estimate Retention Impact. Determine how fixing this point might improve retention rates. Even a 1% improvement in retention can lead to a 25-95% increase in profit.
Step 3: Calculate the Value. Multiply the retained customers by their average CLV.
Step 4: Subtract Cost. Subtract the cost of implementing the fix from the projected gain.
This method demonstrates a direct line from a design change to a financial gain. It moves the conversation away from “making it look nice” to “making more money.”
Implementation Steps for Early Validation 🚀
You do not need to map the entire end-to-end journey to prove value. A phased approach allows you to validate the ROI early. Start with high-impact, high-volume journeys.
- Select the Priority Journey. Choose a journey that is critical to revenue or has high pain points. The Onboarding or Checkout journey are usually the best starting points.
- Establish a Baseline. Document the current performance metrics. Do not guess; use existing data from analytics platforms or CRM systems.
- Identify Quick Wins. Look for low-effort, high-impact changes that can be implemented immediately.
- Implement and Measure. Roll out the changes and track the leading indicators listed earlier.
- Report the Delta. Compare the baseline to the new results. Highlight the difference.
By focusing on quick wins first, you build momentum. Stakeholders see results in weeks, not months. This success creates the budget and trust needed for larger, more complex mapping projects later.
Presenting to Leadership 🗣️
How you present the data is just as important as the data itself. Executives often have limited time. Your presentation must be concise, visual, and action-oriented.
Follow this structure for your stakeholder presentations:
- The Hook: Start with the business problem (e.g., “We are losing 10% of customers at checkout”).
- The Insight: Show the journey map highlighting the specific friction point.
- The Solution: Briefly explain the proposed fix.
- The Projection: Show the estimated financial impact (ROI).
- The Ask: Clearly state what resources you need to proceed.
Use visuals. A journey map is a visual tool, so your slides should reflect that. Avoid walls of text. Use charts for metrics and diagrams for the journey flow. If you are presenting to a non-technical audience, avoid jargon. Use terms like “steps,” “blocks,” and “progress” instead of “touchpoints,” “friction,” and “conversion.”
Common Mistakes to Avoid ❌
Even with a solid strategy, teams often stumble on execution. Avoid these common pitfalls to ensure your ROI analysis remains credible.
- Ignoring the Baseline: You cannot measure improvement if you don’t know where you started. Always record current metrics before making changes.
- Overpromising: Be realistic about timelines and gains. If you promise a 50% increase and deliver 10%, you lose credibility. Under-promise and over-deliver.
- Isolating the Data: Do not present CX metrics in isolation. Always correlate them with business metrics. If CES improves but revenue drops, investigate why.
- One-Off Analysis: Treat ROI as a continuous process. Customer behavior changes, so your metrics and assumptions must evolve.
- Blaming the Customer: Never suggest the customer is “wrong.” Frame issues as system or process failures. This keeps the focus on organizational improvement.
Building a Long-Term View 📅
While early wins are crucial for buy-in, the true power of journey mapping lies in the long term. It shifts the organization from a product-centric view to a customer-centric view. This shift creates a culture where every decision is evaluated through the lens of customer impact.
Over time, this cultural shift reduces the need for constant justification. When CX becomes embedded in the decision-making process, the ROI is no longer a separate calculation; it is a standard outcome of good business practice.
To maintain this momentum:
- Regular Reviews: Schedule quarterly reviews of journey metrics with leadership.
- Knowledge Sharing: Share success stories across departments so everyone sees the value.
- Iterate: Update maps as the business grows. A journey map from three years ago is likely outdated.
- Expand Scope: Start with one journey, then move to others. Show how the framework works across the organization.
Summary of Value Drivers 📌
To recap, proving the value of customer journey mapping requires a disciplined approach to data and communication. You must move beyond abstract concepts and tie every insight to a tangible business outcome. By focusing on leading indicators, aligning with departmental goals, and presenting clear financial models, you can secure the support needed to drive meaningful change.
Remember, the goal is not just to create a map, but to create a roadmap for growth. When stakeholders see that understanding the customer leads to better revenue, lower costs, and happier teams, the investment becomes obvious. The journey mapping process is the engine; the ROI is the proof that the car is moving.
Start with one journey. Measure the baseline. Implement a fix. Show the result. Repeat. This cycle builds the authority and trust required to scale customer experience initiatives across the entire organization.

