


A deployment diagram serves as a critical blueprint within the software engineering landscape. It visualizes the physical architecture of a system, detailing how software components are distributed across hardware nodes. Unlike class diagrams that focus on static structures or sequence diagrams that map interactions over time, the deployment diagram anchors the application in reality. It answers the question of where code actually runs.
Understanding this artifact is essential for DevOps practitioners, system architects, and backend engineers. It bridges the gap between abstract design and physical infrastructure. This guide explores the core elements, construction methods, and strategic applications of deployment diagrams.
🔍 What Is a Deployment Diagram?
A deployment diagram is a type of Unified Modeling Language (UML) diagram. It depicts the hardware elements, known as nodes, and the software artifacts that reside on them. It provides a static view of the runtime architecture. This visualization is vital for understanding system topology.
Consider a modern web application. It is rarely a single monolith running on one machine. Instead, it involves multiple servers, databases, load balancers, and client devices. A deployment diagram maps these entities and their communication channels.
Key Objectives
- Infrastructure Planning: Helps teams visualize resource requirements before provisioning.
- Communication Mapping: Defines how different nodes talk to each other.
- Security Boundaries: Illustrates firewalls, gateways, and trusted zones.
- Scalability Analysis: Shows how the system grows horizontally or vertically.
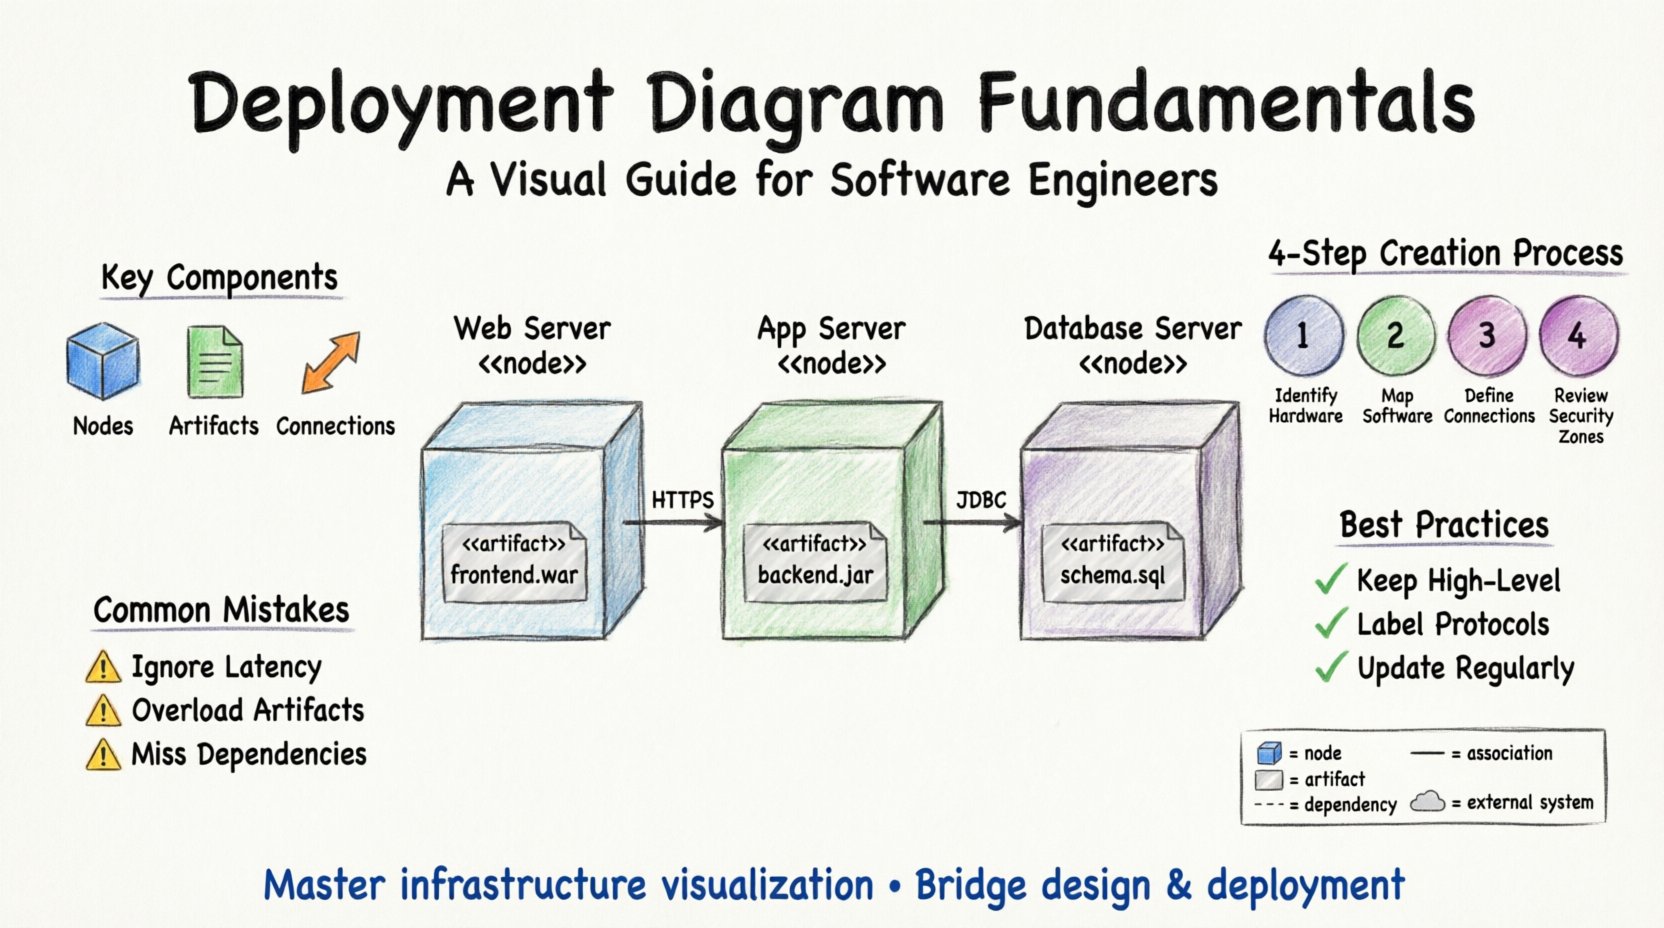
🧩 Core Components
To construct an accurate deployment diagram, you must understand its building blocks. Every diagram is composed of nodes, artifacts, and connections.
1. Nodes
A node represents a physical or virtual computing resource. It is a container for artifacts. Nodes are typically represented as 3D boxes with the stereotype <<node>> placed above the name.
- Computational Nodes: These are devices that process data. Examples include servers, workstations, mainframes, and mobile devices.
- Execution Environments: Software platforms that host the application logic. This could be a runtime environment for a specific language or an operating system.
- Data Stores: Specialized nodes dedicated to persistent storage. Examples include database servers, file servers, and object storage systems.
Each node has a name and often an IP address or domain name associated with it in real-world implementations.
2. Artifacts
Artifacts are the physical pieces of software that are deployed onto the nodes. They represent the deliverables of the development process. Without artifacts, a node is just empty hardware.
- Executable Files: The compiled code that runs on the server.
- Libraries: Dependencies required for the executable to function.
- Configuration Files: Settings that dictate how the software behaves in that specific environment.
- Databases: Schema definitions or data files stored within a database node.
- Web Pages: Static HTML files or templates served to clients.
Artifacts are usually depicted as small rectangles with the stereotype <<artifact>>. They are often shown inside the node they reside on.
3. Connections
Connections illustrate the communication paths between nodes. They show how data flows through the system architecture. These lines represent network links.
- Network Protocols: Labels on the lines indicate the protocol used, such as TCP/IP, HTTP, HTTPS, or SQL.
- Communication Channels: Thick lines often represent high-bandwidth connections, while thinner lines might indicate management traffic.
- Dependencies: Dashed lines can show that one node relies on another for operation.
📋 Symbol Legend and Notation
Standardization ensures that engineers from different teams can read the same diagram. The following table outlines common symbols used in deployment diagrams.
| Symbol | Name | Description |
|---|---|---|
| 3D Box | Node | A physical or virtual computing resource where software runs. |
| Rectangle with <<artifact>> | Artifact | A deployable piece of software, like a jar file or database. |
| Solid Line | Association | A structural link between two elements. |
| Dashed Line | Dependency | One element requires another to function. |
| Open Arrow | Navigation | Indicates a dependency direction or data flow path. |
| Cloud Shape | External System | Represents a third-party service or external network. |
| Rectangle with <<device>> | Device | A specific hardware device like a router or switch. |
| Rectangle with <<interface>> | Interface | Defines the contract for interaction between nodes. |
🛠️ How to Create a Deployment Diagram
Creating a deployment diagram is a systematic process. It requires knowledge of the system’s requirements and the infrastructure constraints. Follow these steps to build a reliable map.
Step 1: Identify the Hardware
Begin by listing all physical devices involved. Do not skip the edge devices. In a distributed system, this includes:
- Client devices (laptops, phones, tablets).
- Network equipment (routers, firewalls, load balancers).
- Application servers.
- Database servers.
- Storage systems.
If the system uses cloud infrastructure, these nodes are virtual instances rather than physical boxes, but they are still represented as nodes in the diagram.
Step 2: Map the Software
Once the hardware is defined, place the software artifacts onto them. This step determines where the logic lives.
- Identify which server runs the backend API.
- Locate the web server hosting the frontend.
- Specify which database holds user data.
- Mark where caching layers sit.
Ensure that every artifact is placed on a compatible node. For instance, a Java application cannot run directly on a database node without an execution environment.
Step 3: Define Connections
Draw the lines that connect the nodes. Label these lines with the protocols being used.
- Frontend to Backend: Typically uses HTTP or HTTPS over TCP.
- Backend to Database: Often uses specific drivers like JDBC or ODBC.
- Internal Services: May use gRPC, REST, or message queues.
Be specific about the protocols. This helps in security auditing and performance tuning.
Step 4: Review Security Zones
Deployment diagrams often include security boundaries. These are logical containers that group nodes sharing the same security posture.
- DMZ (Demilitarized Zone): Contains public-facing servers like web servers.
- Internal Network: Contains databases and application servers that are not directly accessible from the internet.
- Trusted Zone: Contains sensitive management systems.
Use different colors or shaded regions to distinguish these zones visually.
📈 Best Practices for Clarity
A diagram that is too complex fails to communicate. Adhere to these principles to maintain clarity and utility.
- Keep it High-Level: Do not include every single microservice if they reside on the same node. Group them logically.
- Use Consistent Naming: Use standard names for nodes across all diagrams in the project.
- Label Protocols: Never leave a connection line unlabeled. Ambiguity leads to configuration errors.
- Separate Concerns: If the system is massive, split the diagram into layers (e.g., Client Layer, App Layer, Data Layer).
- Update Regularly: A deployment diagram is only useful if it reflects the current state. Update it during infrastructure changes.
❌ Common Mistakes to Avoid
Engineers often make errors when modeling infrastructure. Recognizing these pitfalls prevents technical debt in documentation.
1. Ignoring Network Latency
Placing nodes too close together on the page might imply they are physically near. In reality, a database in one region and an app in another introduces latency. Use annotations to indicate geographic separation.
2. Overloading Artifacts
Putting too many artifacts on a single node makes the diagram messy. If a server hosts multiple services, consider grouping them under a sub-node or a specific container.
3. Missing External Dependencies
Systems rarely exist in a vacuum. Often, they rely on third-party APIs or SaaS platforms. Always include external clouds or services that the system connects to.
4. Static vs. Dynamic Confusion
A deployment diagram is static. It does not show traffic volume or request rates. Do not try to represent dynamic load balancing behavior with static lines alone. Use additional notation or separate diagrams for that.
🔗 Relationship to Other Diagrams
The deployment diagram does not exist in isolation. It works in tandem with other modeling artifacts.
- Class Diagram: The class diagram defines the code structure. The deployment diagram defines where that code executes.
- Component Diagram: The component diagram shows logical grouping of code. The deployment diagram maps those groups to physical nodes.
- Sequence Diagram: The sequence diagram shows interaction flow. The deployment diagram provides the context for where that flow occurs.
Understanding these relationships ensures a cohesive architectural documentation set. When a change is made in the class diagram, the deployment diagram may need to be updated if the new component requires a different resource.
🌐 Real-World Application Scenarios
Deployment diagrams are used in various contexts throughout the software lifecycle.
1. Disaster Recovery Planning
When planning for failures, teams use deployment diagrams to identify single points of failure. If a critical database is on a single node with no backup connection, the diagram highlights this risk immediately.
2. Cost Optimization
Cloud costs are driven by resource usage. By visualizing the infrastructure, teams can identify underutilized nodes. Consolidating services onto fewer, more powerful nodes can reduce operational expenses.
3. Security Audits
Security teams review deployment diagrams to ensure sensitive data does not traverse insecure channels. They look for unencrypted connections between the application and the database.
4. Onboarding New Engineers
New team members often struggle to understand the system topology. A clear deployment diagram serves as a map for navigation. It helps them understand where to deploy code and where to look for logs.
🔄 Maintenance and Evolution
Software systems evolve. New features require new nodes. Old nodes are retired. The deployment diagram must evolve with the system.
- Version Control: Treat the diagram file as code. Store it in the same repository as the source code.
- Automated Generation: In modern environments, some tools can generate deployment diagrams from infrastructure code (IaC). This keeps the diagram in sync automatically.
- Review Cycles: Include diagram updates in the definition of done for major architectural changes.
Ignoring maintenance leads to “diagram rot.” This occurs when the documentation no longer matches the reality. When a developer tries to deploy based on an outdated diagram, failures are inevitable.
📊 Summary of Key Takeaways
This guide has covered the essential aspects of deployment diagrams. To recap the core points:
- Nodes represent hardware: They are the containers for your software.
- Artifacts represent software: These are the files and data that run on the nodes.
- Connections represent communication: They define the protocols and data flow.
- Clarity is king: Keep the diagram readable and focused on the infrastructure.
- Update constantly: Ensure the diagram matches the live environment.
Mastering this skill allows you to design systems that are robust, scalable, and secure. It transforms abstract requirements into concrete infrastructure plans.
🚀 Moving Forward
As you continue your engineering journey, apply these principles to your current projects. Start by sketching the deployment diagram for your next microservice. Identify the nodes, place the artifacts, and draw the connections. Review it with your team to ensure everyone shares the same understanding of the physical layout.
Documentation is an investment in system stability. A well-drawn deployment diagram pays dividends during troubleshooting, scaling, and security reviews. Make it a standard part of your architecture workflow.

