


A Deployment Diagram serves as the physical blueprint for a software system. Unlike other UML diagrams that focus on logical structure or behavior, this specific view maps the hardware and software infrastructure. It illustrates where the system components are actually executed. Understanding the key elements is essential for architects and developers who need to visualize the topology of an application environment. This guide breaks down the core components, relationships, and best practices involved in creating effective deployment models.
🏗️ Understanding the Deployment Diagram Context
System architecture requires more than just code; it requires a physical home. The deployment diagram provides that context. It answers critical questions about the runtime environment. Where does the application run? What are the dependencies between hardware and software? How do different nodes communicate? This diagram bridges the gap between design and implementation. It connects the logical software components to the physical nodes that host them.
For teams working on distributed systems, this diagram is indispensable. It clarifies the boundaries between services and identifies potential bottlenecks in the network. By standardizing the visual representation, stakeholders can agree on the infrastructure requirements before deployment begins. This reduces ambiguity during the build phase. It also serves as a reference for operations teams managing the live environment.
🖥️ Core Components: Nodes and Devices
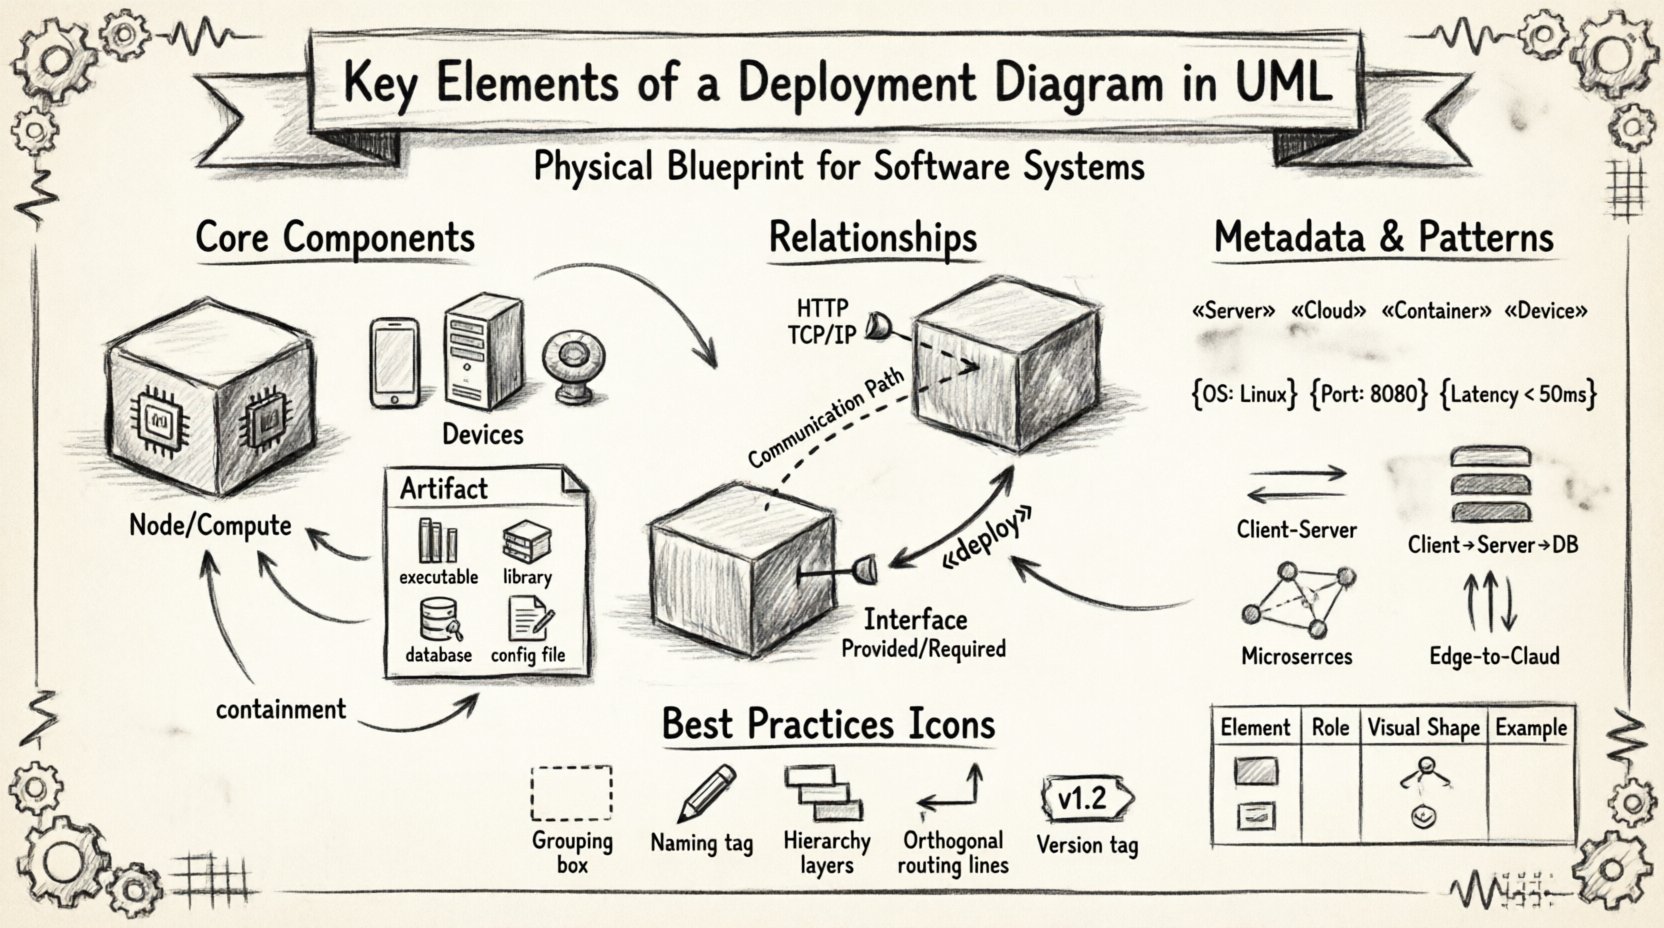
At the heart of a deployment diagram are the nodes. These represent the computational resources where software artifacts reside. Nodes are the foundational building blocks of the physical architecture. They can range from simple end-user devices to complex server clusters.
1. Compute Nodes
A compute node represents a processing unit with memory and execution capabilities. It is often synonymous with a server or a virtual machine instance. In modern contexts, this could be a container host or a cloud function instance. Key characteristics include:
- Processing Power: The node must have sufficient CPU capacity to handle the assigned workloads.
- Memory: RAM availability determines how many applications can run simultaneously.
- OS Compatibility: The node must support the operating system required by the software artifacts.
When modeling a compute node, the shape typically resembles a cube or a generic box. Inside the node, you place the specific software components that execute there. This containment relationship is crucial for understanding resource allocation.
2. Devices
Devices are distinct from compute nodes in their role. They often represent end-user hardware or specialized hardware peripherals. Examples include workstations, smartphones, tablets, and IoT sensors. While compute nodes focus on heavy lifting, devices focus on interaction and data collection.
- User Interface: Devices are often the point of access for human users.
- Data Input: Sensors and input devices gather data from the physical world.
- Connectivity: Devices must maintain a connection to the network to function.
It is important to distinguish between a generic device and a specific hardware model. In high-level diagrams, the specific model is less relevant than the capability. However, for hardware-specific deployments, the exact model might be noted to ensure driver compatibility.
3. Execution Environments
Not all nodes are equal. Some represent specific execution environments. A node might be labeled as a “Java Runtime Environment” or a “Web Server.” This adds semantic value to the diagram. It tells the reader exactly what software stack is running on the hardware. This distinction helps in troubleshooting and capacity planning.
📦 Artifacts: The Software Content
Artifacts are the physical representations of the software components. While components describe the logical structure of the code, artifacts describe the actual files or binaries deployed. They are the tangible items that move from a development environment to a production server.
Types of Artifacts
- Executables: Binary files that run directly on the operating system.
- Libraries: Shared code modules required by the executable.
- Databases: Schema files or data stores residing on a server.
- Configuration Files: Settings that define how the application behaves.
- Web Pages: Static HTML or CSS files served to clients.
Artifacts are usually drawn as rectangles with a tab in the top right corner. This visual cue distinguishes them from logical components. Placing an artifact inside a node indicates that the file is installed on that specific machine. If an artifact is not inside a node, it implies it is being transferred or is in a repository.
Deployment Relationships
How an artifact gets to a node is described by a deployment relationship. This is a directed association. It shows that the artifact is being deployed to the node. The relationship often carries a stereotype to indicate the nature of the deployment. For example, it might be labeled as “copy” or “link.” This adds precision to the diagram.
🔗 Communication Paths and Interfaces
Nodes do not exist in isolation. They communicate to share data and coordinate tasks. The deployment diagram must show how these connections are established. This is achieved through communication paths and interfaces.
Communication Paths
A communication path connects two nodes. It represents the network channel used for data exchange. This could be a local area network, a wide area network, or a specific protocol link. The path itself is often a simple line connecting the nodes.
- Network Type: Specify if the connection is wired, wireless, or virtual.
- Protocol: Indicate the communication protocol (e.g., HTTP, TCP/IP, SSH).
- Bandwidth: High-level diagrams might note bandwidth requirements.
When modeling cloud architectures, communication paths often cross network boundaries. Security is a major concern here. The diagram should imply where firewalls or encryption might be necessary. Visualizing the path helps identify single points of failure in the network topology.
Interfaces
Interfaces define the points of interaction between nodes. They specify the contracts that must be met for communication to succeed. An interface is often represented as a circle or a lollipop notation attached to a node.
- Provided Interfaces: Services that the node offers to others.
- Required Interfaces: Services that the node needs from others to function.
Mapping interfaces ensures that dependencies are clear. If Node A requires an interface that Node B provides, the relationship is explicit. This prevents integration errors during the system assembly phase.
🧩 Stereotypes and Constraints
To add depth to the diagram without cluttering it, modelers use stereotypes and constraints. These are metadata tags that provide additional information about the elements.
Stereotypes
A stereotype is a keyword enclosed in guillemets (e.g., <<stereotype>>). It modifies the standard UML element. Common stereotypes for deployment diagrams include:
- <<Device>>: Indicates a generic hardware device.
- <<Server>>: Indicates a dedicated server node.
- <<Cloud>>: Indicates a node hosted in a cloud environment.
- <<Container>>: Indicates a containerized runtime environment.
Using stereotypes allows the diagram to remain flexible. You can change the specific implementation details without redrawing the entire structure. It abstracts the technology stack while retaining the architectural intent.
Constraints
Constraints are conditions that must be met for the deployment to be valid. They are often written inside braces. Examples include:
- {OS: Linux} – The node must run Linux.
- {Port: 8080} – The application listens on port 8080.
- {Latency < 50ms} – The communication path must be low latency.
Constraints help in compliance and security audits. They ensure that the deployment meets specific regulatory or performance standards. Documenting these limits on the diagram prevents configuration drift.
📋 Comparison of Deployment Elements
To clarify the distinctions between the various elements, the following table summarizes their roles and visual representations.
| Element | Role | Visual Shape | Example |
|---|---|---|---|
| Node | Computational resource | 3D Cube or Box | Application Server |
| Artifact | Physical software file | Rectangle with Tab | Binary Executable |
| Communication Path | Network connection | Line | Internet Link |
| Interface | Interaction point | Circle or Lollipop | API Endpoint |
| Device | End-user hardware | Rectangular Device Icon | Mobile Phone |
Using this table as a reference ensures consistency across different diagrams within the same project. It helps team members quickly identify the purpose of each symbol.
🎨 Best Practices for Diagram Design
Creating a deployment diagram requires more than just placing shapes on a canvas. It requires a disciplined approach to layout and information hierarchy. Good design reduces cognitive load for anyone reading the architecture.
1. Grouping and Nesting
Use containment to show relationships. If multiple nodes belong to the same data center or cloud region, group them visually. Use a boundary box to represent the environment. This makes the diagram scalable. As the system grows, you can add nodes to the group without changing the overall structure.
2. Naming Conventions
Consistent naming is vital. Use a standard format for node names. For example, prefix server names with their function (e.g., APP-01, DB-01). Avoid generic names like Server1. Specific names make troubleshooting easier when the diagram is used as a reference during incidents.
3. Hierarchy of Detail
Do not try to show every detail in one diagram. Create a high-level overview first. Then, create detailed diagrams for specific subsystems. A single diagram containing hundreds of nodes becomes unreadable. Splitting the architecture into logical sections maintains clarity.
4. Connection Management
Network lines can become tangled quickly. Use orthogonal routing for paths. Avoid crossing lines whenever possible. If lines must cross, use a bridge symbol to indicate no connection. This prevents misinterpretation of the topology.
5. Version Control
Deployment diagrams evolve. Software updates change the infrastructure. Hardware is replaced. Networks are reconfigured. Keep the diagram versioned. Tag the diagram with the release version it represents. This ensures that the documentation matches the deployed reality.
🌐 Common Architectural Patterns
There are standard patterns that deployment diagrams often depict. Recognizing these patterns helps in communicating the system design efficiently.
Client-Server Model
This is the most traditional pattern. A client device requests services from a server node. The diagram shows a clear flow of data from the device to the server. The server processes the request and returns a response. This pattern is common in enterprise applications.
Multi-Tier Architecture
Complex systems often use multiple tiers. A presentation tier handles the user interface. An application tier handles the business logic. A data tier handles storage. The deployment diagram shows these tiers on separate nodes. This separation improves scalability and security.
Microservices
In modern cloud-native architectures, systems are broken into small services. Each service runs on its own container or node. The deployment diagram shows many small nodes communicating over a network. This pattern emphasizes loose coupling and independent deployment.
Edge Computing
Edge computing places processing closer to the data source. The diagram shows devices at the edge connected to a central cloud. Data is processed locally to reduce latency. This is common in IoT scenarios where network reliability is a concern.
⚠️ Common Pitfalls to Avoid
Even experienced modelers make mistakes. Being aware of common errors helps maintain the integrity of the documentation.
- Ignoring Latency: Failing to note that certain nodes are geographically distant can lead to performance issues.
- Overloading Nodes: Showing too many artifacts on one node makes the diagram cluttered.
- Missing Security Layers: Omitting firewalls or load balancers hides critical infrastructure details.
- Static Representation: Treating the diagram as static when the system is dynamic can cause confusion.
- Lack of Labels: Unlabeled connections make it impossible to understand the data flow.
Addressing these pitfalls early ensures the diagram remains useful throughout the system lifecycle. Regular reviews with the operations team can help identify gaps in the model.
🔄 Maintenance and Evolution
A deployment diagram is a living document. As the system changes, the diagram must change with it. This requires a process for updating the model. When a new server is added, the diagram should be updated. When a service is deprecated, the node should be removed.
Automated tools can help keep the diagram synchronized with the infrastructure. Some systems allow importing real-time topology data. While manual modeling offers flexibility, automated synchronization reduces the risk of outdated information. However, manual review is still necessary to validate the logical correctness of the architecture.
Documentation should be stored alongside the code repositories. This ensures that developers have access to the infrastructure map when writing new features. It also aids in onboarding new team members who need to understand the system landscape.
🛠️ Practical Implementation Steps
When starting a new deployment diagram, follow a structured approach.
- Identify the Scope: Determine what part of the system you are modeling.
- List the Nodes: Catalog all the hardware and virtual machines involved.
- Identify Artifacts: List the software components that need to be installed.
- Define Connections: Draw the network paths between nodes.
- Add Constraints: Note any specific requirements for the environment.
- Review: Check the diagram with the team for accuracy.
This workflow ensures nothing is overlooked. It creates a comprehensive view of the system. Following these steps consistently leads to reliable architectural documentation.
📈 Conclusion on Visualization
The deployment diagram is a critical tool for system architects. It translates abstract requirements into a concrete physical plan. By mastering the key elements—nodes, artifacts, paths, and interfaces—teams can build robust systems. The visual clarity provided by this diagram reduces risk during deployment. It aligns the development and operations teams on a shared understanding of the infrastructure.
Investing time in creating accurate diagrams pays off during maintenance and troubleshooting. When issues arise, the diagram serves as a map to the problem. It guides the investigation process. Therefore, maintaining high-quality deployment diagrams is not just a documentation task; it is a strategic asset for system reliability.

