


Software architecture relies heavily on visual communication to bridge the gap between abstract logic and physical infrastructure. Among the various modeling techniques available, the deployment diagram stands out as a primary tool for mapping the hardware and software environment of a system. This guide provides a structured approach to creating these diagrams, ensuring clarity for stakeholders, developers, and operations teams alike.
📚 Understanding the Deployment Diagram
A deployment diagram depicts the physical hardware and software components of a system. Unlike a sequence diagram, which focuses on time-based interactions, or a class diagram, which focuses on data structures, the deployment diagram focuses on where things run. It illustrates the static structure of the runtime environment.
This type of diagram is essential for understanding how software artifacts are distributed across nodes. It helps answer critical questions regarding system topology, resource allocation, and connectivity.
🔍 Key Distinctions
- Deployment vs. Component: Component diagrams show logical groupings of code. Deployment diagrams show where those groupings are executed.
- Deployment vs. Infrastructure: While infrastructure diagrams focus on network cables and routers, deployment diagrams focus on the logical mapping of applications to those resources.
- Static vs. Dynamic: This diagram represents a static snapshot of the architecture at a specific point in time.
🧱 Core Components and Notation
Before beginning the drawing process, it is necessary to understand the standard notation elements used in this modeling technique. Consistency in notation ensures that anyone reviewing the diagram can interpret the architecture without ambiguity.
🖥️ Nodes
A node represents a computational resource. It is typically depicted as a 3D cube. There are two main types of nodes:
- Device Nodes: Represent physical hardware, such as servers, workstations, routers, or mainframes. These are often labeled with hardware specifications.
- Execution Environment Nodes: Represent a software platform that hosts other components. Examples include application servers, database engines, or container runtimes.
📦 Artifacts
Artifacts represent physical pieces of software information. They are what is actually deployed onto the nodes. Common artifacts include:
- Executable Files: The compiled binary code of an application.
- Database Files: The data storage structures and schemas.
- Libraries: Shared code modules required by the application.
- Configuration Files: Settings that define how the software behaves.
- Scripts: Automation code used for deployment or maintenance.
🔗 Connections
Connections illustrate the communication pathways between nodes. These lines indicate how data flows between components. Common connection types include:
- Network Protocols: HTTP, HTTPS, TCP/IP, or SQL.
- Physical Links: Cables or wireless connections.
- Communication: General logical links indicating data exchange.
🗺️ The Step-by-Step Process
Creating a robust deployment diagram requires a methodical approach. Rushing into drawing nodes without understanding the data flow often leads to confusing diagrams that fail to serve their purpose.
Step 1: Define the Scope and Boundaries 🎯
Begin by establishing what the diagram will cover. A single diagram rarely depicts an entire enterprise ecosystem. Instead, focus on a specific system or a cluster of related services.
- Identify the system boundary: What is included inside the diagram?
- Identify external dependencies: What systems interact with this system but are not part of it?
- Define the level of abstraction: Is this for high-level architecture or detailed infrastructure setup?
Step 2: Identify the Nodes 🖥️
List all the computational resources required. This involves analyzing the application requirements and the infrastructure constraints.
- Client Devices: User interfaces such as web browsers or mobile applications.
- Application Servers: The environment where business logic executes.
- Database Servers: Dedicated machines for persistent data storage.
- Middleware: Message brokers, load balancers, or proxy servers.
Step 3: Map the Artifacts 📦
Once nodes are defined, determine which software artifacts reside on which nodes. This step links the code to the hardware.
- Place the main executable file on the application server.
- Assign database files to the database server.
- Ensure configuration files are accessible to the correct services.
- Mark shared libraries that are used by multiple nodes.
Step 4: Establish Connections 🔗
Draw lines between the nodes to represent communication. Label these connections with the protocols used.
- Indicate the direction of data flow using arrows.
- Specify the protocol (e.g., HTTPS, REST, gRPC) on the connecting lines.
- Ensure all critical paths are represented, including backup and failover routes.
Step 5: Review and Validate ✅
Before finalizing the diagram, perform a validation check.
- Does every node have a purpose?
- Are all artifacts accounted for?
- Are the connections logically sound (e.g., no direct database access from a client browser)?
- Is the diagram readable for the intended audience?
📊 Comparison of Node Types
Understanding the distinction between different node types is crucial for accurate modeling. The table below summarizes the key differences.
| Node Type | Representation | Primary Function | Example Label |
|---|---|---|---|
| Device Node | 3D Cube | Physical hardware resource | Web Server |
| Execution Environment | 3D Cube with stereotype | Software platform hosting apps | JVM, .NET Runtime |
| Process Node | Label inside a node | Running instance of a software | Application Instance 1 |
| Remote Node | 3D Cube with external label | External system outside boundary | Payment Gateway |
🎨 Best Practices for Clarity
A diagram that is too complex becomes useless. Adhering to best practices ensures the diagram remains a valuable reference tool throughout the development lifecycle.
🔎 Maintain Abstraction Levels
Do not attempt to show every detail in one view. Use different levels of abstraction for different audiences.
- Executive View: High-level nodes only. Focus on major systems and external dependencies.
- Architectural View: Include application servers, databases, and key middleware.
- Implementation View: Include specific versions, configuration details, and network ports.
🏷️ Use Consistent Naming Conventions
Labels should be descriptive and consistent. Avoid vague terms like “Server1” unless it is a specific naming standard in your organization.
- Use functional names: “Primary Web Server” instead of “ServerA”.
- Include environment tags: “Dev DB”, “Prod API”.
- Keep labels concise but informative.
🛡️ Represent Security Zones
Security is a critical aspect of deployment. Use boundaries or groupings to indicate security domains.
- Draw a boundary line around the internal network.
- Label the boundary as “DMZ” (Demilitarized Zone) or “Private Network”.
- Indicate firewalls on the connection lines between zones.
- Mark encrypted connections explicitly (e.g., “SSL/TLS”).
🔄 Keep it Updated
A deployment diagram that is outdated is worse than no diagram. Integrate diagram updates into your standard operating procedures.
- Review the diagram during every major release cycle.
- Update the diagram when infrastructure changes (e.g., migrating to a new cloud provider).
- Link the diagram to the configuration management system if possible.
🚧 Common Pitfalls to Avoid
Even experienced architects can fall into traps when creating these diagrams. Being aware of common mistakes can save time during reviews and implementation.
❌ Over-Complicating the Topology
Adding every switch, router, and cable can obscure the main architecture. Focus on the logical flow of data rather than the physical cabling unless the physical network is the subject of the diagram.
❌ Ignoring Asynchronous Communication
Not all connections are synchronous request/response. Use distinct line styles or labels to indicate event-driven or queue-based communication (e.g., Message Queues).
❌ Missing External Dependencies
Often, a system relies on third-party services. Failing to show these external nodes can lead to deployment failures when the system cannot reach the required external APIs or databases.
❌ Mixing Logical and Physical Views
Do not mix logical components (like “User Interface”) with physical nodes (like “Laptop”) in the same box without clear distinction. Keep the logical model separate from the physical deployment model.
🔧 Advanced Scenarios
Beyond basic deployments, modern architectures introduce complexities that require specific handling in your diagrams.
🌐 Cloud Native Architectures
When modeling cloud-based systems, the concept of nodes changes slightly. Physical servers are abstracted away by the cloud provider.
- Focus on services rather than machines (e.g., “Object Storage”, “Serverless Function”).
- Represent regions and availability zones as boundaries.
- Indicate auto-scaling capabilities on nodes.
🐳 Containerization
In containerized environments, the node often hosts a runtime engine rather than the application directly.
- Show the “Orchestration Engine” node (e.g., a cluster manager).
- Show the “Container Runtime” within that node.
- Place the container artifacts inside the runtime environment.
🔄 Distributed Systems
For systems spread across multiple locations, geographic distribution becomes key.
- Use geographic labels (e.g., “US-East”, “EU-West”).
- Highlight latency-sensitive connections.
- Indicate data replication paths between nodes.
📝 Maintenance and Evolution
A deployment diagram is a living document. It must evolve as the system evolves. This section outlines how to manage the diagram over time.
🗓️ Version Control
Treat the diagram file like code. Store it in a version control system.
- Commit changes with descriptive messages (e.g., “Added load balancer to DMZ”).
- Tag versions corresponding to software releases.
- Review the history to understand architectural changes.
🤝 Collaboration
Architecture is rarely a solo effort. Ensure the diagram is accessible to the team.
- Share the diagram with developers to confirm artifact placement.
- Share with operations teams to verify infrastructure readiness.
- Share with security teams to validate network segmentation.
🔑 Summary of Key Takeaways
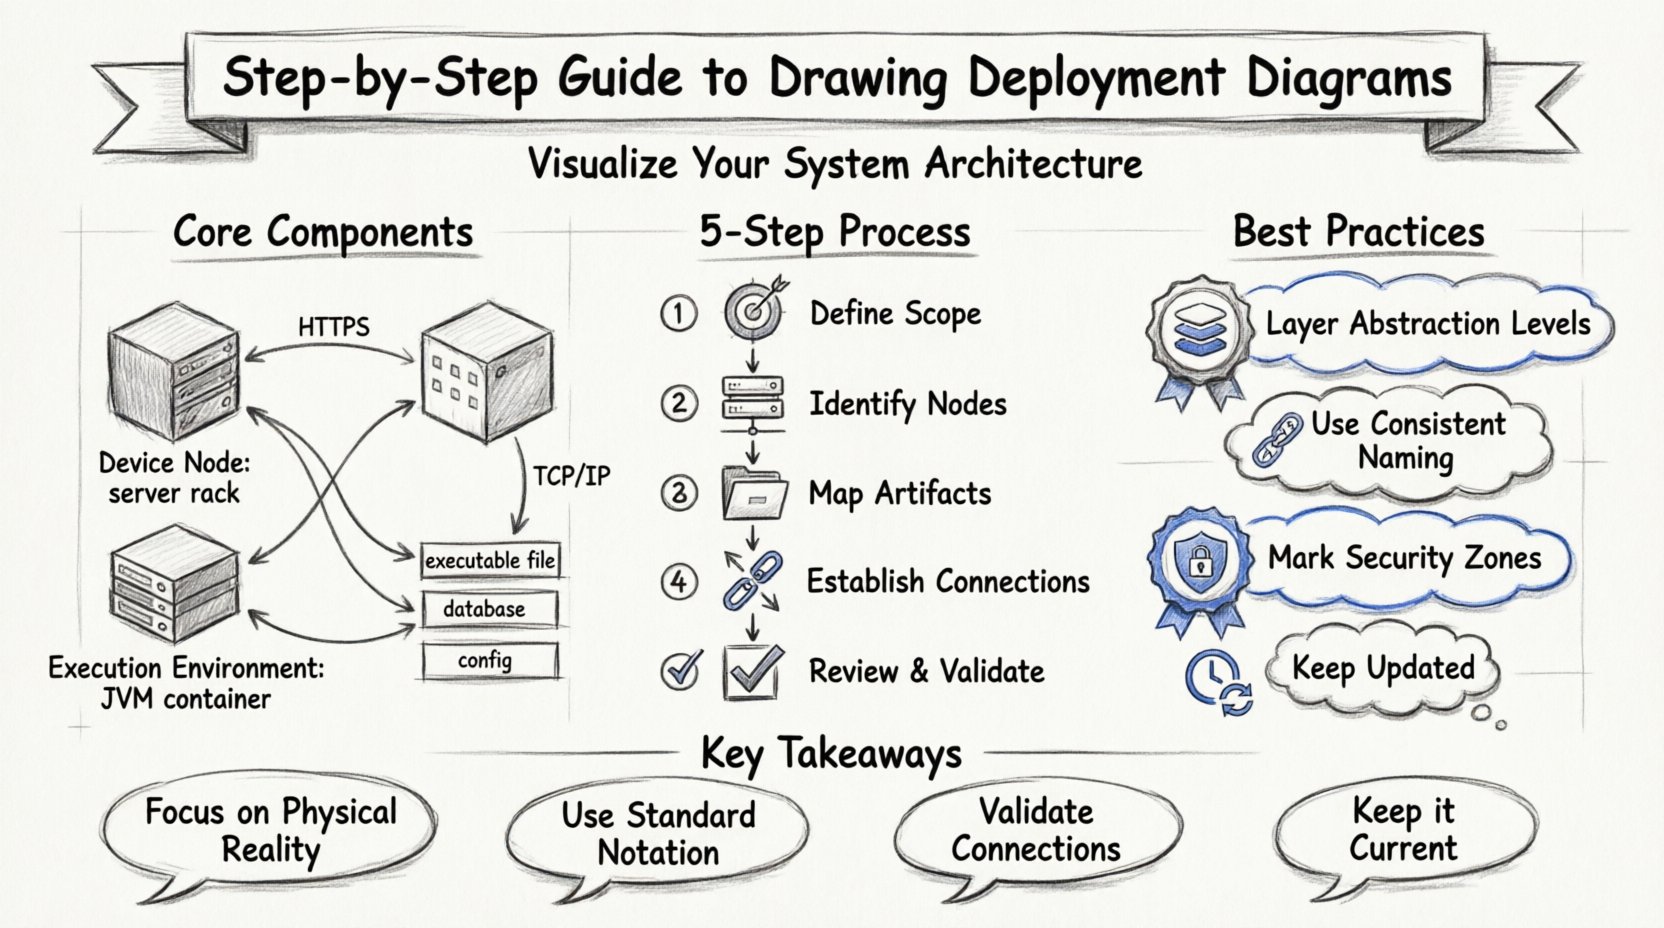
- Focus on Physical Reality: Deployment diagrams are about hardware and runtime environments, not just code.
- Use Standard Notation: Stick to recognized symbols for nodes, artifacts, and connections.
- Layer Your Abstraction: Create different diagrams for different levels of detail.
- Validate Connections: Ensure data flows logically between the nodes.
- Keep it Current: An outdated diagram misleads the team and hinders deployment.
🎯 Final Thoughts on Architecture Visualization
Creating deployment diagrams is a fundamental skill for any technical architect. It forces a disciplined approach to thinking about how software interacts with the physical world. By following the steps outlined in this guide, you can produce diagrams that are not just pictures, but functional blueprints for your infrastructure.
Remember that the goal is communication. If the diagram is not understood by the people building or running the system, it has failed its purpose. Prioritize clarity over complexity, and ensure that every element on the page serves a specific function in conveying the system’s architecture.
As your systems grow in complexity, your diagrams will need to adapt. Embrace the iterative nature of this process. Regular updates and careful review cycles will ensure your documentation remains a reliable asset throughout the lifecycle of your software projects.

