


Modern software delivery often relies on intricate systems designed to move code from development environments into production. When these systems fail, the impact can be significant. A deployment diagram serves as a blueprint for these infrastructures, mapping out nodes, artifacts, and their interactions. However, a diagram is only as useful as its alignment with the actual running environment. When discrepancies arise, systematic troubleshooting becomes essential. This guide explores how to diagnose and resolve issues within complex deployment architectures without relying on specific vendor tools or products.
Understanding the Deployment Diagram 📐
Before attempting to fix a problem, one must understand what the architecture represents. A deployment diagram illustrates the physical or logical structure of the system. It details where software components reside and how they communicate. In complex setups, this often involves multiple layers of abstraction.
Nodes: These represent the computing resources where artifacts are deployed. They can be physical machines, virtual instances, or containers.
Artifacts: These are the software packages being installed on the nodes. They include binaries, configuration files, and libraries.
Connections: These define the communication paths between nodes. They specify protocols, ports, and data types.
Dependencies: These show the prerequisites required for a node to function correctly.
When an issue occurs, the first step is to compare the diagram against the current state of the infrastructure. Mismatches here are often the root cause of failures.
Common Failure Modes ⚠️
Complex architectures introduce multiple points of failure. Understanding the typical failure modes helps narrow down the investigation quickly. Issues generally fall into categories related to connectivity, configuration, resources, or security.
1. Connectivity and Network Issues 🌐
Network problems are among the most frequent causes of deployment failure. Even if the diagram shows a valid connection, the network might block traffic.
Firewall Rules: Ports required for communication may be closed by intermediate firewalls or security groups.
DNS Resolution: Services often rely on domain names. If the DNS is not configured correctly, nodes cannot locate each other.
Subnet Configuration: Nodes in different network segments may not have the necessary routing tables to communicate.
Load Balancers: Traffic distribution logic might be misconfigured, sending requests to unhealthy nodes.
2. Configuration Drift ⚙️
Configuration drift occurs when the actual state of a node diverges from the intended state defined in the deployment plan. This often happens when manual changes are made directly to a production environment.
Environment Variables: Missing or incorrect variables can cause services to fail to start or behave unexpectedly.
File Permissions: Incorrect permissions on configuration files can prevent the application from reading necessary data.
Version Mismatches: Libraries or dependencies installed on the node may not match the version specified in the artifact.
3. Resource Constraints 💾
Even a perfectly configured architecture will fail if the underlying hardware cannot support the load. Resource exhaustion is a silent killer of deployment reliability.
CPU Saturation: High utilization can lead to latency or service timeouts.
Memory Leaks: Applications that do not release memory properly can cause the host to run out of RAM.
Disk Space: Logs and temporary files can fill up storage, preventing new data from being written.
Network Bandwidth: Insufficient throughput can cause data transfer failures between nodes.
4. Security and Permissions 🔒
Security protocols are critical for protecting data, but they can also block legitimate traffic if configured too restrictively.
Identity Access Management: Service accounts might lack the permissions required to access other resources.
Certificate Validation: SSL/TLS certificates that are expired or self-signed can break encrypted connections.
Authentication Tokens: Expired or invalid tokens can prevent services from authenticating with each other.
Diagnostic Methodology 🔍
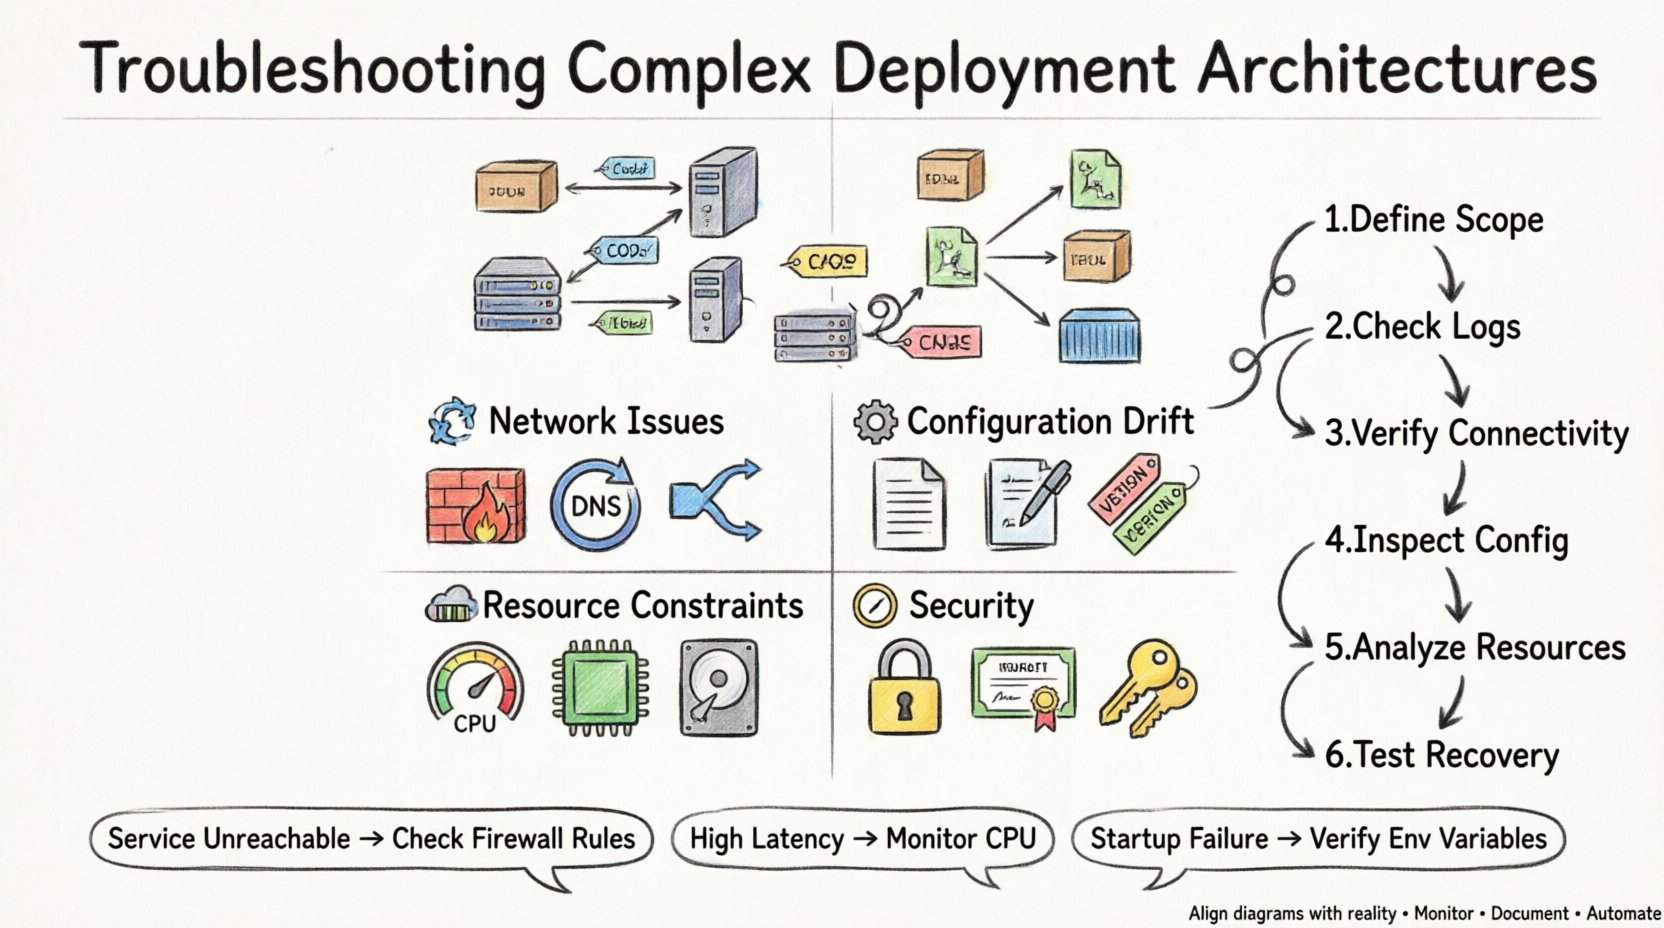
When troubleshooting, a structured approach prevents wasted time. Follow these steps to isolate the problem efficiently.
Define the Scope: Determine exactly which part of the architecture is failing. Is it the entire system, a specific node, or a specific connection?
Check the Logs: Review application and system logs for error messages. Look for timestamps that align with the failure event.
Verify Connectivity: Use network tools to test reachability between nodes. Check if ports are open and responding.
Inspect Configuration: Compare the current configuration against the baseline defined in the deployment diagram.
Analyze Resource Usage: Monitor CPU, memory, and disk usage during the failure window.
Test Recovery: Attempt to restart services or roll back changes to see if the issue resolves.
Table: Common Symptoms vs. Diagnostic Actions 📋
This table summarizes frequent symptoms and the corresponding actions required to diagnose them.
Symptom | Potential Cause | Diagnostic Action |
|---|---|---|
Service Unreachable | Network Firewall | Check Security Groups and Firewall Rules |
High Latency | CPU Saturation | Monitor CPU Utilization Metrics |
Startup Failure | Missing Configuration | Verify Environment Variables and Files |
Connection Reset | Resource Exhaustion | Check Memory and Disk Space Usage |
Authentication Error | Certificate Expiry | Inspect SSL/TLS Certificate Validity |
Pipeline Stuck | Dependency Timeout | Review Network Connectivity to External Repos |
Deep Dive: Network Diagnostics 🌐
Network issues are particularly tricky because they often appear intermittent. When a deployment diagram shows a connection between Node A and Node B, but traffic is not flowing, you must investigate the path.
1. Tracing the Route
Use network tracing tools to identify where packets are dropped. This helps determine if the issue lies within the local network, across the internet, or at the destination node.
Packet Capture: Analyze traffic at the source and destination to see if packets are sent and received.
Routing Tables: Verify that nodes know how to route traffic to each other.
MTU Settings: Maximum Transmission Unit mismatches can cause packet fragmentation and loss.
2. DNS and Service Discovery
Many modern architectures rely on service discovery mechanisms rather than hardcoded IP addresses. If the discovery service is down, nodes cannot find each other.
Record Validation: Ensure DNS records point to the correct IP addresses.
Cache Issues: DNS caching can lead to stale data. Flush DNS caches if necessary.
Internal vs External: Distinguish between internal service names and external domain names.
Deep Dive: Configuration Management ⚙️
Configuration management ensures that all nodes in the architecture are in a known state. When this process fails, the deployment becomes unstable.
1. Infrastructure as Code
Defining infrastructure using code allows for version control and reproducibility. However, syntax errors or logical flaws in the code can cause deployment failures.
Validation: Run syntax checks before applying changes.
State Files: Ensure the state file accurately reflects the current infrastructure.
Drift Detection: Implement tools to detect when manual changes occur.
2. Secrets Management
Sensitive data such as passwords and API keys must be stored securely. Improper handling can lead to security breaches or deployment failures.
Encryption: Ensure secrets are encrypted at rest and in transit.
Rotation: Regularly rotate credentials to minimize risk.
Access Control: Limit access to secrets to only the necessary services.
Deep Dive: Resource Management 💾
Resource constraints often manifest during peak usage times. Planning for capacity is essential to prevent outages.
1. Scaling Strategies
Architectures should be designed to scale horizontally or vertically based on demand. If scaling fails, the system may become unresponsive.
Horizontal Scaling: Add more instances to handle increased load.
Vertical Scaling: Increase the resources of existing instances.
Auto-Scaling: Configure rules to automatically adjust resources based on metrics.
2. Monitoring and Alerting
Proactive monitoring helps identify resource issues before they cause failures.
Thresholds: Set alerts for CPU, memory, and disk usage.
Logs: Aggregate logs from all nodes for centralized analysis.
Tracing: Use distributed tracing to track requests across services.
Deep Dive: Security and Permissions 🔒
Security is not an afterthought; it must be integrated into the deployment process.
1. Least Privilege
Services should only have the permissions necessary to function. Over-permissioned services increase the attack surface.
Roles: Define specific roles for different services.
Policies: Apply policies that restrict access to specific resources.
Audit: Regularly audit permissions to ensure compliance.
2. Network Security
Network segmentation limits the blast radius of a potential breach.
VLANs: Separate traffic by function or environment.
Firewalls: Block unauthorized traffic at the network edge.
Encryption: Encrypt all data in transit between nodes.
Pipeline and Automation Integrity 🔄
The pipeline that moves code from development to production is a critical component of the deployment architecture. If the pipeline fails, no code reaches the environment.
1. Pipeline Stages
Break down the pipeline into distinct stages to isolate failures.
Build: Compile code and create artifacts.
Test: Run automated tests to verify functionality.
Deploy: Push artifacts to the target environment.
Verify: Perform post-deployment checks.
2. Rollback Procedures
When a deployment fails, a quick rollback minimizes downtime.
Versioning: Keep previous versions of artifacts available.
Automation: Automate the rollback process to reduce human error.
Testing: Test rollback procedures regularly to ensure they work.
Observability and Logs 🔍
Observability provides insight into the internal state of the system. Without it, troubleshooting is guesswork.
1. Centralized Logging
Collect logs from all nodes in a central location for easier analysis.
Aggregation: Use a log aggregator to collect data.
Indexing: Index logs for fast searching.
Retention: Define retention policies to manage storage.
2. Metrics and Dashboards
Visualize key performance indicators to spot anomalies quickly.
Key Metrics: Track request rates, error rates, and latency.
Alerting: Set up alerts for metric thresholds.
Visualization: Use dashboards to display data over time.
Incident Response and Recovery 🚨
Even with the best planning, incidents will occur. Having a response plan ensures a swift recovery.
1. Incident Classification
Categorize incidents based on severity and impact.
Critical: System is down or data is compromised.
High: Significant degradation of service.
Medium: Minor issues affecting a subset of users.
Low: Cosmetic or non-urgent issues.
2. Communication
Keep stakeholders informed throughout the incident.
Status Updates: Provide regular updates on progress.
Post-Mortem: Analyze the incident after resolution.
Action Items: Assign tasks to prevent recurrence.
Documentation and Version Control 📝
Documentation ensures that knowledge is retained and shared. Version control ensures that changes are tracked.
1. Architecture Documentation
Keep the deployment diagram up to date.
Changes: Document every change to the architecture.
Dependencies: List all external and internal dependencies.
Procedures: Document standard operating procedures.
2. Change Management
Control how changes are made to the environment.
Review: Require reviews for significant changes.
Approval: Obtain approval before applying changes.
Tracking: Track all changes in a system.
Final Considerations for Deployment Health 🏥
Maintaining a healthy deployment architecture requires continuous effort. Regular reviews and updates are necessary to keep pace with changing requirements. Focus on the following areas to ensure long-term stability.
Regular Audits: Conduct periodic audits of the architecture.
Capacity Planning: Plan for future growth.
Training: Train the team on troubleshooting methodologies.
Automation: Automate repetitive tasks to reduce human error.
Testing: Test the architecture regularly in a staging environment.
By following a structured approach to troubleshooting, teams can resolve issues faster and reduce downtime. The goal is not just to fix problems, but to build a system that is resilient and easy to maintain. Deployment diagrams are living documents that should evolve with the infrastructure. When they do, the architecture remains aligned with the business needs.
Remember that every failure is an opportunity to learn. Documenting the root cause and the solution helps prevent similar issues in the future. This knowledge base becomes a valuable asset for the entire organization.
