


Deployment diagrams serve as the blueprint for the physical structure of a software system. They map out the hardware and software components that interact to deliver a functional application to end users. For beginners entering the field of software architecture, understanding these diagrams is essential. They provide clarity on how code moves from development environments to production servers. This guide breaks down the core concepts, symbols, and processes involved in creating effective deployment diagrams.
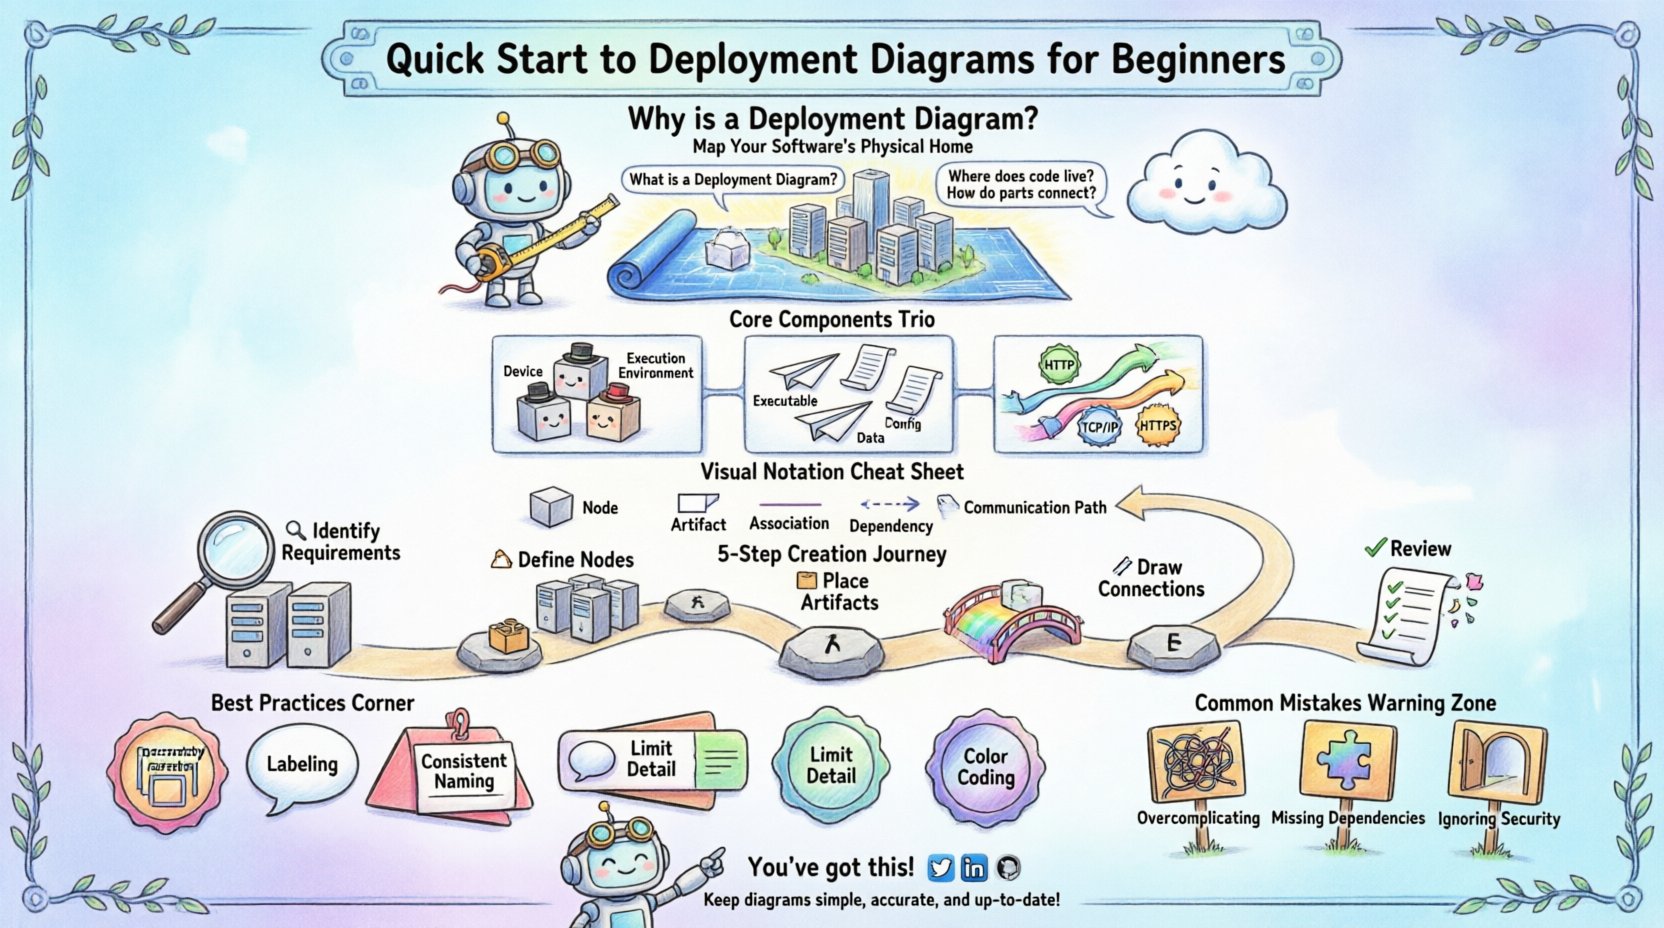
What is a Deployment Diagram? 🤔
A deployment diagram illustrates the runtime architecture of a system. It focuses on the physical deployment of software artifacts on hardware nodes. Unlike logical diagrams that show abstract classes and interfaces, deployment diagrams show the tangible infrastructure. They answer critical questions such as where software runs, how nodes connect, and what protocols facilitate communication.
Key characteristics include:
- Physical View: Represents servers, devices, and networks.
- Software Artifacts: Shows executables, libraries, and data files.
- Communication Paths: Indicates network connections and protocols.
- Scalability: Helps visualize load balancing and redundancy.
When architects design a system, they must ensure that the software fits the hardware constraints. Deployment diagrams facilitate this alignment. They are particularly useful during the migration of legacy systems to cloud environments.
Core Components Explained 🧱
To construct a valid diagram, one must understand the fundamental building blocks. Each element represents a specific aspect of the infrastructure. Using standard notation ensures that team members can interpret the diagram without confusion.
1. Nodes (Execution Environments) 🖥️
Nodes represent physical or virtual computing devices. They are the containers where artifacts reside and execute. There are two primary types of nodes:
- Device Nodes: Physical hardware like routers, servers, or workstations.
- Execution Environment Nodes: Software environments like operating systems or application servers.
Each node has a specific role in the architecture. For example, a web server node handles HTTP requests, while a database node manages data persistence.
2. Artifacts (Deployable Units) 📦
Artifacts are the software components deployed onto nodes. They include executables, libraries, scripts, and configuration files. An artifact is the tangible result of the compilation and build process.
Common artifact types include:
- Executable Files: The compiled code that runs on the server.
- Configuration Files: Settings that define how the software behaves.
- Data Repositories: Database schemas or static content files.
3. Communication Paths (Connections) 🌐
Connections define how nodes interact. They represent the network links between devices. These paths can be physical cables or wireless protocols.
Important connection details include:
- Protocol: TCP/IP, HTTP, HTTPS, or custom protocols.
- Bandwidth: The capacity of the link between nodes.
- Security: Encryption standards applied to the connection.
Visual Notation Standards 📐
Standardizing notation prevents misinterpretation. While various tools exist, the underlying shapes and lines remain consistent across the industry. Adhering to these conventions helps maintain documentation quality.
The following table outlines common symbols and their meanings:
| Symbol | Shape | Meaning |
|---|---|---|
| Node | 3D Cube | Represents a physical device or virtual machine. |
| Artifact | Rectangle with folded corner | Represents a software file or component. |
| Association | Solid Line | Indicates a direct connection between nodes. |
| Dependency | Dashed Line with Arrow | Shows that one node relies on another. |
| Communication Path | Line with Label | Describes the protocol used for data transfer. |
Step-by-Step Creation Process 🛠️
Building a deployment diagram requires a structured approach. Following a logical sequence ensures that no critical component is overlooked. This process applies regardless of the specific diagramming tool used.
Step 1: Identify Infrastructure Requirements 🔍
Begin by listing the hardware needed. Consider the scale of the application. Will it run on a single machine or a distributed cluster? Identify the necessary processing power, memory, and storage capacity.
Step 2: Define the Nodes 🏗️
Draw the boxes representing the devices. Group related nodes together to show logical boundaries. For example, place all database servers in one cluster and web servers in another.
Step 3: Place the Artifacts 📂
Drag and drop the software components onto the appropriate nodes. Ensure that every executable has a home. If a file is shared, indicate the network location.
Step 4: Draw Connections 🔗
Connect the nodes using lines. Label these lines with the communication protocol. For instance, label a connection between a web server and a database as “SQL” or “HTTPS”.
Step 5: Review for Completeness ✅
Check the diagram against the system requirements. Are all ports open? Is there a backup node? Have security zones been defined? This final check ensures the diagram reflects reality.
Best Practices for Clarity ✨
A complex diagram can become difficult to read if not managed well. Clarity is paramount for effective communication. Follow these guidelines to maintain high quality.
- Use Hierarchy: Group related nodes into sub-diagrams or clusters. This reduces visual clutter.
- Label Everything: Every line and box should have a clear label. Avoid leaving connections unlabeled.
- Consistent Naming: Use a standard naming convention for all nodes and artifacts.
- Limit Detail: Do not show every cable in a data center. Focus on logical connectivity.
- Color Coding: Use colors to distinguish environments, such as green for production and red for testing.
Organization plays a significant role in maintenance. When a diagram is well-structured, updates are faster and less prone to errors.
Common Mistakes to Avoid ⚠️
Even experienced practitioners make errors when mapping infrastructure. Being aware of common pitfalls helps improve accuracy.
- Overcomplicating: Trying to show every single server in a large data center can make the diagram unreadable. Abstract where possible.
- Missing Dependencies: Failing to show how a database relies on a specific storage node can lead to deployment failures.
- Ignoring Security Zones: Not distinguishing between public-facing servers and internal databases creates security risks.
- Outdated Information: Diagrams must be updated whenever infrastructure changes. An old diagram is worse than no diagram.
- Confusing Logical and Physical: Do not mix class diagrams with deployment diagrams. Keep the views distinct.
Integration with Development Workflows 🔄
Deployment diagrams are not static documents. They evolve alongside the software. Integrating them into the development lifecycle ensures they remain relevant.
Consider how these diagrams fit into modern practices:
- Infrastructure as Code: The diagram should match the configuration scripts used to provision resources.
- Continuous Deployment: As new versions are released, update the artifact labels to reflect version numbers.
- Incident Response: Use the diagram to trace issues during outages. It helps identify which node failed.
- Security Audits: Review the diagram to check for exposed ports or unencrypted connections.
Scalability and Redundancy 📈
Systems rarely remain static. Growth requires planning. Deployment diagrams help visualize how to scale the application.
Key considerations for scaling include:
- Load Balancing: Show how incoming traffic is distributed across multiple web servers.
- Failover: Indicate backup nodes that take over if the primary node fails.
- Data Replication: Map out how database data is copied across regions.
- Network Topology: Understand how bandwidth constraints affect performance.
When planning for growth, the diagram acts as a strategic map. It helps teams decide where to invest resources for maximum efficiency.
Maintenance and Updates 📝
Once the diagram is created, it requires ongoing care. Infrastructure changes frequently due to software updates or hardware replacements.
Establish a routine for maintenance:
- Quarterly Reviews: Schedule regular checks to verify the diagram against the current state.
- Change Management: Require updates to the diagram whenever a change request is approved.
- Version Control: Store diagram files in a repository to track history.
- Stakeholder Access: Ensure developers and operations teams have access to the latest version.
Documentation is a living process. Neglecting updates leads to confusion and potential operational errors.
Security Implications 🔒
Deployment diagrams reveal the attack surface of a system. Security teams use them to identify vulnerabilities.
Key security checks include:
- Firewall Placement: Ensure diagrams show where firewalls sit between networks.
- Data Encryption: Verify that connections between sensitive nodes are encrypted.
- Access Control: Check which nodes require authentication.
- Segmentation: Ensure that critical systems are isolated from public networks.
A clear diagram makes security auditing much faster. It highlights where protections are missing or where risks are concentrated.
Final Thoughts on Architecture 🏛️
Deployment diagrams are a vital tool for any technical team. They bridge the gap between code and hardware. By mastering the basics of nodes, artifacts, and connections, you gain a deeper understanding of system behavior.
Remember that these diagrams are communication tools. Their primary purpose is to convey information clearly to other team members. Keep them simple, accurate, and up to date. This approach ensures that the architecture remains transparent and manageable throughout the lifecycle of the software.
Start with small diagrams for simple projects. As the complexity grows, so will your ability to manage intricate infrastructures. With practice, creating these maps becomes a natural part of the design process.

