


In the landscape of software engineering and system design, visualizing logic is just as critical as writing code. Activity diagrams serve as the bridge between abstract requirements and concrete implementation. They provide a dynamic view of a system, illustrating how data flows through processes and where decisions occur. Whether you are analyzing a banking transaction or mapping a user registration flow, understanding these diagrams ensures that your team shares a single source of truth. This guide explores the core mechanics of UML activity diagrams, focusing on workflow modeling and decision logic without the noise of commercial tools.
What Is an Activity Diagram? 🤔
An activity diagram is a type of behavioral diagram in the Unified Modeling Language (UML). It describes the flow of control from activity to activity. Think of it as a sophisticated flowchart that handles concurrency, decision points, and object flow. While flowcharts are useful for simple scripts, activity diagrams offer the structural depth needed for complex systems.
- Dynamic View: They show the sequence of actions over time.
- Process Flow: They map out the steps required to complete a task.
- Concurrency: They can represent actions happening simultaneously.
- State Changes: They visualize how objects move through different states during a process.
Unlike use case diagrams, which focus on who interacts with the system, activity diagrams focus on what happens within the system. They are essential for detailing business processes, algorithm logic, and operational workflows.
Core Elements of an Activity Diagram 🔧
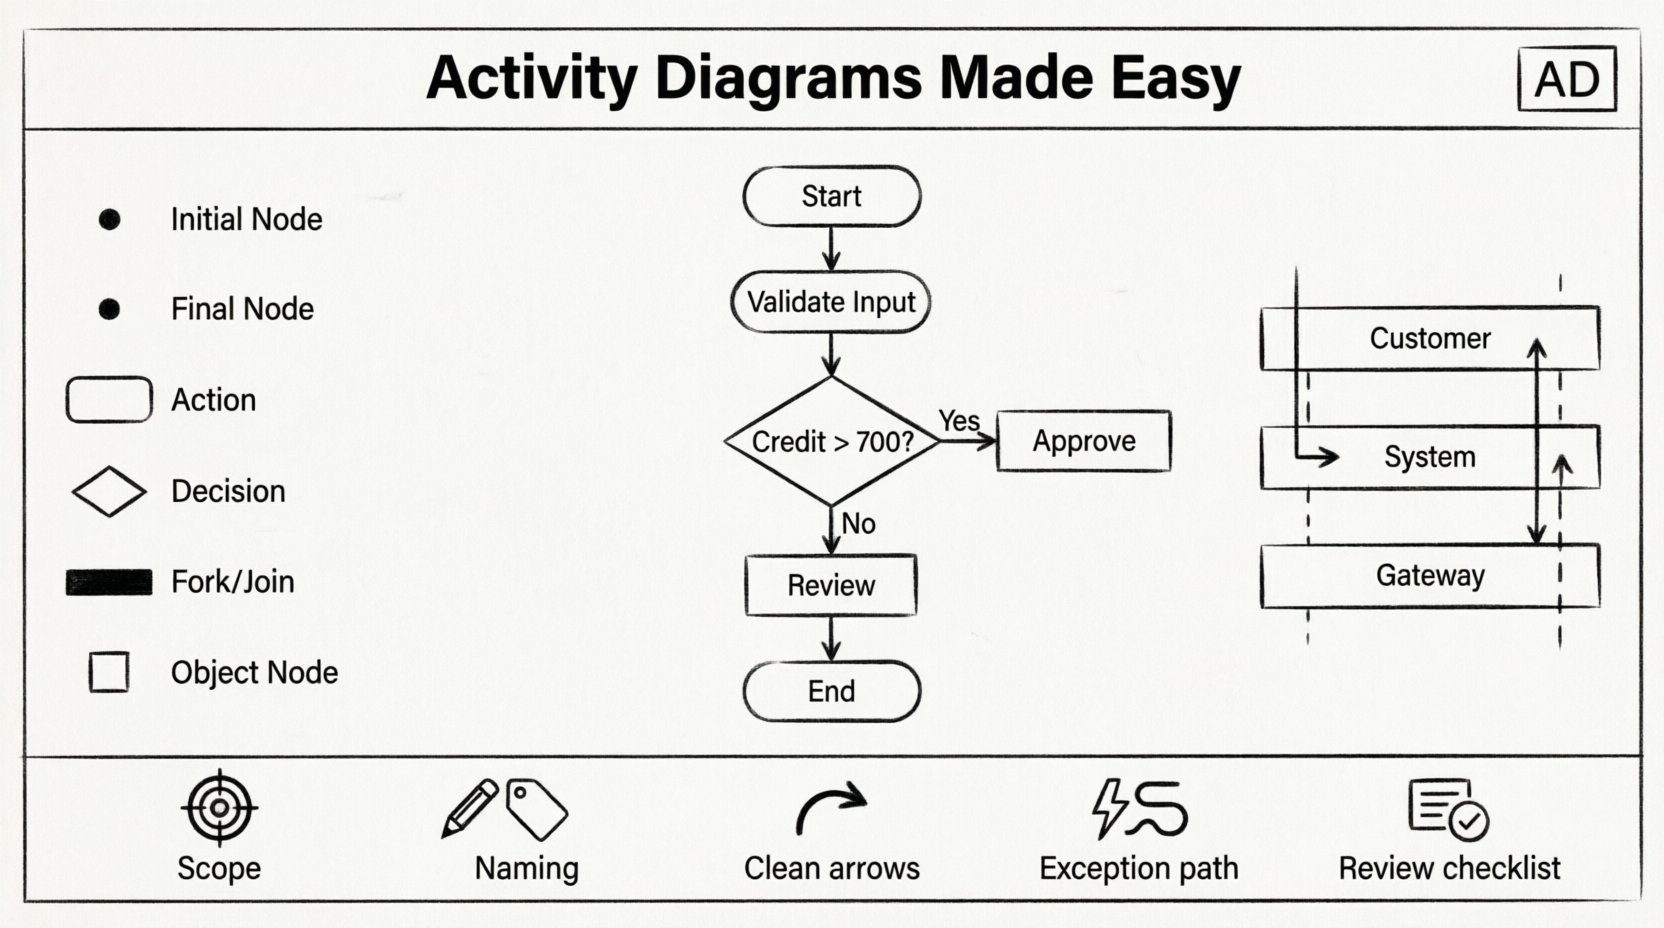
To construct a readable diagram, you must understand the standard notation. Each symbol carries a specific meaning. Using the correct shapes prevents ambiguity during code implementation.
1. Initial Node (Start Point) ⚫
The process begins here. It is represented by a solid black circle. There should be exactly one initial node per activity diagram, marking the entry point for the flow.
2. Final Node (End Point) 🔴
The process concludes here. It is a black circle surrounded by a thick ring. A diagram can have multiple final nodes if the workflow can terminate in different ways (e.g., success vs. failure).
3. Activity Node (Action) 🟦
These are the rounded rectangles that represent work being performed. An action is a step in the process. It can be a single operation or a complex sub-process. Labels inside the box should describe the verb-object pair, such as “Validate Input” or “Send Notification”.
4. Decision Node (Diamond) 📐
This is a diamond shape used for branching logic. It splits the flow based on a condition. Unlike a decision box in a flowchart, the UML decision node typically outputs to multiple outgoing edges, each guarded by a specific condition.
5. Merge Node (Diamond) 📐
Used to combine multiple incoming flows into a single outgoing flow. It does not perform logic; it simply unites paths that diverged earlier.
6. Fork and Join Nodes (Bar) ⏸️
These thick black bars manage concurrency.
- Fork: Splits one incoming flow into multiple concurrent flows.
- Join: Waits for all incoming concurrent flows to complete before continuing.
7. Object Node (Box) 📦
These represent the creation, modification, or consumption of data objects. They connect to action nodes to show data movement.
Organizing Complexity with Swimlanes 🏊♂️
As workflows grow, a flat diagram becomes a tangled mess. Swimlanes introduce a layer of organization by partitioning the diagram into areas of responsibility. This helps identify who or what performs each action.
Swimlanes can be arranged horizontally or vertically. Each lane represents a specific actor, system component, department, or class. For example, in an e-commerce order process, you might have lanes for Customer, Order System, and Payment Gateway.
| Swimlane Type | Best Used For | Benefit |
|---|---|---|
| Organizational | Departments or Roles | Clarifies human responsibility |
| Process | System Phases | Highlights system state changes |
| Interface | External Systems | Shows integration points clearly |
When drawing within a lane, ensure actions are placed inside the boundaries. An arrow crossing from one lane to another indicates a handoff or communication between components. This visual cue is vital for understanding system boundaries.
Modeling Workflow and Control Flow 🔄
The backbone of an activity diagram is the control flow. This is the sequence of nodes and transitions that dictates the order of execution. Understanding how to control this flow is the difference between a usable model and a confusing sketch.
Sequential Flow
Most actions occur in a linear sequence. An arrow connects the output of one activity to the input of the next. This implies that the first action must complete before the second begins. In simple workflows, this is the dominant pattern.
Parallel Concurrency (Fork/Join)
Real-world systems often perform tasks simultaneously. For instance, when a user submits an order, the system might simultaneously check inventory and calculate taxes. A Fork node splits the control flow into two or more threads. A Join node ensures that all threads complete before the process moves forward.
If you use a join without a corresponding fork, you risk creating a deadlock where the process waits indefinitely for a thread that never started. Always pair these elements logically.
Object Flow
Control flow moves instructions. Object flow moves data. Distinguish between the two. An action might consume an object (input) and produce a new object (output). Represent this with dashed lines connecting object nodes to action nodes.
Decision Points and Guard Conditions 🚦
Logic is the heart of any workflow. Activity diagrams use decision nodes to handle branching paths. Each outgoing edge from a decision node must have a guard condition. A guard condition is a boolean expression that determines which path is taken.
Writing Effective Guard Conditions
- Be Specific: Avoid vague conditions like “Check Error.” Use “Is Error Code Null” instead.
- Exhaustive Coverage: Ensure all possible outcomes are covered. If there are two paths, one should be “True” and the other “False” (or “Else”).
- Readability: Place the condition on the arrow, not inside the node.
Consider a loan approval process. The decision node might ask: “Credit Score > 700?”. One path leads to “Approve Loan,” and the other leads to “Request Review.” If you omit the “Else” path, the diagram implies the process stops, which is incorrect.
Nesting Decisions
Complex logic often requires nested decisions. A decision inside a decision can quickly become unreadable. To maintain clarity:
- Use swimlanes to separate logical sections.
- Break large processes into sub-activities.
- Limit the branching factor at any single node (ideally 2 to 4 branches).
Best Practices for Clear Modeling ✅
Creating a diagram is not enough; it must be maintainable and understandable by stakeholders. Adhere to these guidelines to ensure high-quality models.
1. Define the Scope Clearly
Start with a single goal. Do not try to model the entire enterprise system in one diagram. Focus on a specific use case or business process. If the diagram becomes too large, it loses its utility. Break it down into manageable chunks.
2. Use Consistent Naming Conventions
Labels should follow a standard format. A common pattern is Verb + Noun for activity nodes (e.g., “Process Payment”). For decision nodes, use questions or conditions (e.g., “Is Balance Sufficient?”).
3. Avoid Spaghetti Logic
Long, winding arrows that cross over each other create cognitive load. Try to keep the flow top-to-bottom or left-to-right. If arrows must cross, use bridges or connectors to keep the visual path clear.
4. Handle Exception Flows
Many diagrams only show the “Happy Path” (the perfect scenario). A robust diagram accounts for errors. Include paths for validation failures, network timeouts, or rejected transactions. This prevents surprises during implementation.
5. Review for Completeness
Before finalizing, check the following:
- Does every fork have a corresponding join?
- Are all paths leading to a final node?
- Are there any dead ends (nodes with no outgoing arrows)?
- Are object flows consistent with the actions?
Activity Diagrams vs. Other UML Diagrams 🆚
It is common to confuse activity diagrams with sequence or state machine diagrams. Understanding the distinction ensures you use the right tool for the job.
| Diagram Type | Focus | When to Use |
|---|---|---|
| Activity Diagram | Workflow and Logic | Modeling complex processes, algorithms, or business rules. |
| Sequence Diagram | Interaction over Time | Modeling message passing between objects in a specific scenario. |
| State Machine Diagram | State Transitions | Modeling objects that have distinct states (e.g., Order: Pending, Shipped). |
| Use Case Diagram | Functional Requirements | Identifying actors and high-level system functions. |
Use an activity diagram when you need to show how a process works internally. Use a sequence diagram when you need to show who talks to whom to achieve that process.
Common Pitfalls to Avoid 🚫
Even experienced modelers make mistakes. Being aware of common errors saves time during the review phase.
- Missing Initial Nodes: A diagram without a start point is ambiguous. Where does the flow begin?
- Loops Without Exit: Infinite loops can occur if a decision node always directs flow back to a previous step without a termination condition.
- Over-Abstraction: Making steps too vague (e.g., “Do Work”) makes the diagram useless for developers. Be specific about the action.
- Mixing Control and Object Flow: Ensure you use solid lines for control flow (execution) and dashed lines for object flow (data). Mixing them confuses the reader.
- Ignoring Concurrency: If two actions happen at the same time, but you draw them sequentially, you misrepresent the system’s performance requirements.
Step-by-Step Modeling Process 🛠️
How do you actually create a diagram from scratch? Follow this logical progression.
- Identify the Actors: Determine who or what participates in the process (User, System, Database).
- Define the Trigger: What starts the activity? (e.g., “User Clicks Submit”).
- Map the Steps: List the actions required to complete the task in order.
- Insert Decision Points: Identify where choices are made. Add guard conditions.
- Add Swimlanes: Assign each step to the responsible actor.
- Review for Concurrency: Are any steps happening in parallel? Add fork and join nodes.
- Verify End States: Ensure all paths lead to a valid conclusion (Success or Error).
Integration with Development Lifecycle 🚀
Activity diagrams are not just documentation; they are part of the development lifecycle. They can serve as a basis for code generation in some environments, though manual implementation is more common. They are particularly valuable during the design review phase.
During code review, developers can trace the logic from the diagram to the code. If the diagram shows a validation check that the code lacks, a gap is identified immediately. This reduces the risk of logic errors in production.
Furthermore, these diagrams aid in testing. Test cases can be derived directly from the paths in the diagram. Every branch represents a potential test scenario. This ensures comprehensive coverage without writing unnecessary tests for unachievable paths.
Advanced Concepts: Comments and Groups 📝
UML allows for comments to provide additional context. These are represented by a rectangle with a folded corner. Use them to explain complex logic that cannot be easily expressed in a node label. Do not rely on comments for core logic, but use them for clarifications.
Groups can be used to visually cluster related activities. While they do not affect the execution flow, they help organize large diagrams. For example, group all “Payment Processing” activities together within a specific boundary.
Maintaining Diagrams Over Time ⏳
Software evolves. Requirements change. A diagram that was accurate six months ago may now be obsolete. Treat diagrams as living documents.
- Version Control: Keep diagrams alongside the code in your repository.
- Update Triggers: Update the diagram whenever the workflow changes significantly.
- Sanity Checks: Periodically review the diagram against the current system to ensure alignment.
Neglecting maintenance turns diagrams into documentation debt. It is better to have a simple, up-to-date diagram than a complex, outdated one.
Final Thoughts on Workflow Visualization 🌟
Mastering activity diagrams requires practice and a disciplined approach to modeling. They are powerful tools for communicating complex logic across teams. By focusing on clear notation, proper use of swimlanes, and rigorous logic checking, you can create models that truly reflect the system’s behavior.
Remember, the goal is not just to draw a picture, but to facilitate understanding. A well-designed activity diagram reduces ambiguity, aligns expectations, and streamlines the development process. Whether you are planning a new feature or refactoring an old system, investing time in these diagrams pays dividends in code quality and team efficiency.
Start small. Model one simple workflow. Gradually add complexity as you become comfortable with forks, joins, and decision nodes. With time, the notation will become second nature, allowing you to focus on the logic rather than the symbols.

