


A customer journey map is often mistaken for a simple visual aid. Many teams create a chart, pin it to a wall, and consider the work done. However, the true value of a customer journey map lies not in its aesthetics, but in its ability to reveal friction, highlight opportunities, and align internal operations around the customer’s experience. It is a diagnostic tool, a strategic asset, and a living document that requires precision to function effectively.
To build a journey map that drives actual change, you must understand its anatomy. Every component serves a specific purpose, from the foundational personas to the emotional curves that dictate behavior. This guide breaks down the essential elements that separate a decorative diagram from a functional strategy.
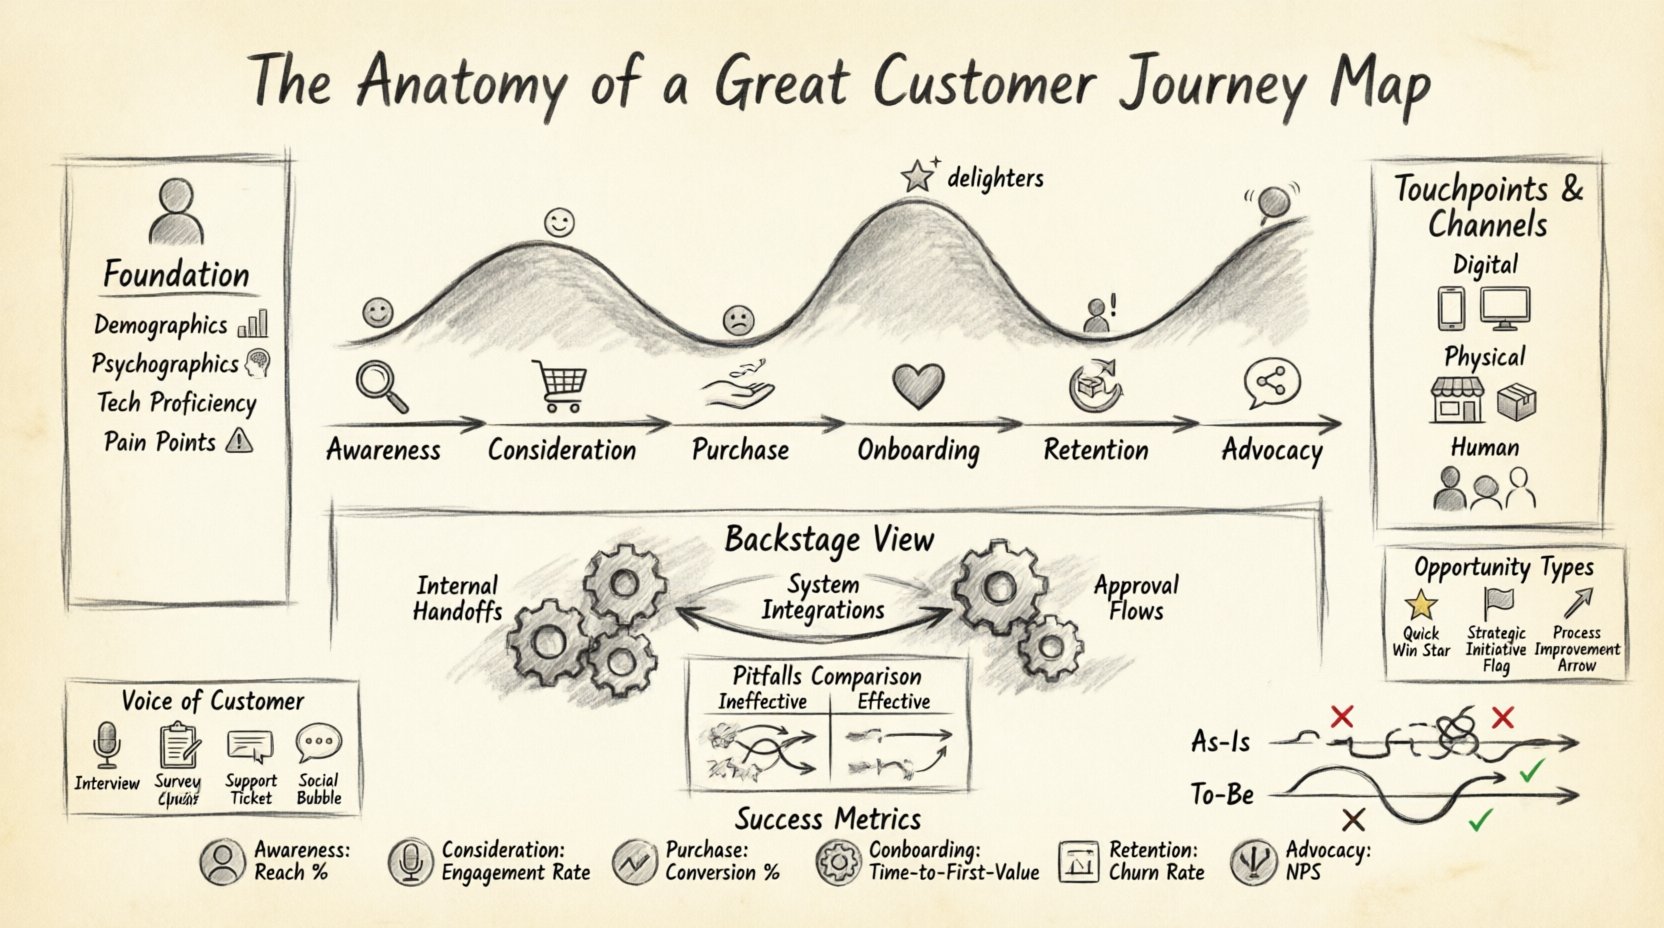
1. The Foundational Elements: The Skeleton of the Map 🦴
Before plotting any touchpoints, you must establish the context. A journey map without a defined subject is merely a generic flowchart. The foundation rests on three critical pillars that define the scope and perspective of the document.
1.1. The Persona Definition 👤
The map must represent a specific archetype, not the “average” customer. Personas provide the narrative voice. When you define the persona, you are defining the motivations, goals, and constraints that drive the journey.
- Demographics: Age, location, and role help contextualize the environment.
- Psychographics: Values, fears, and motivations drive decision-making.
- Tech Proficiency: This determines which channels are viable touchpoints.
- Current Pain Points: What problems are they trying to solve before they even contact you?
Without a detailed persona, the map becomes a theoretical exercise. With it, the map becomes a reflection of a real human being navigating your ecosystem.
1.2. The Stages of the Journey 📅
The horizontal axis of your map represents time or progression. Standardizing these stages ensures consistency across different maps. While industry specifics vary, most journeys follow a logical progression:
- Awareness: The customer realizes they have a problem or need.
- Consideration: They research potential solutions and evaluate options.
- Purchase/Decision: They select a solution and commit to it.
- Onboarding: The immediate period after acquisition where adoption begins.
- Retention: The ongoing usage and relationship maintenance.
- Advocacy: The customer recommends the product to others.
Each stage requires different messaging and support. A strategy designed for the Awareness stage will fail in the Retention stage. Mapping these stages allows you to tailor interventions appropriately.
1.3. Touchpoints and Channels 📱
A touchpoint is any interaction a customer has with your brand. These occur across various channels. It is crucial to distinguish between the channel (where the interaction happens) and the touchpoint (the specific instance of interaction).
- Digital: Website, mobile app, email, social media, chatbots.
- Physical: Retail stores, events, packaging, direct mail.
- Human: Sales calls, customer support interactions, onboarding sessions.
A comprehensive map accounts for both owned channels and shared channels. For instance, a customer might read a review on a third-party site (shared) before clicking a link on your website (owned). Missing these external touchpoints creates blind spots in the experience.
2. The Emotional Dimension: The Heartbeat ❤️
Functional steps are not enough. You must map the emotional state of the customer at each stage. Emotions drive memory and loyalty more than features do. This is often visualized as an emotional curve.
2.1. Identifying Emotional Peaks and Valleys 📉
Customers do not move through a journey in a straight line of satisfaction. They experience spikes of joy and valleys of frustration. Identifying these moments is critical.
- Delighters: Moments where the experience exceeds expectations. These drive advocacy.
- Frustrations: Moments of friction or confusion. These drive churn.
- Apathy: Moments where the customer feels indifferent. These are opportunities to engage.
By plotting emotions, you can pinpoint exactly where the experience breaks down. A drop in sentiment during the Onboarding stage suggests a need for better guidance. A spike in satisfaction during Advocacy indicates a strong referral potential.
2.2. The Voice of the Customer (VoC) 👂
Emotional mapping cannot rely on assumptions. It requires data. Qualitative and quantitative research fuels the emotional curve.
- Interviews: One-on-one conversations reveal the “why” behind feelings.
- Surveys: NPS and CSAT scores provide quantitative benchmarks.
- Support Logs: Ticket history shows recurring issues and sentiment over time.
- Social Listening: Unfiltered comments on public platforms reveal raw sentiment.
When you anchor emotional data to specific touchpoints, the map becomes evidence-based. This removes the guesswork from strategic planning.
3. Data Integration and Internal Processes 🧠
A journey map is useless if it exists in a vacuum. It must connect the customer experience to the internal machinery that powers it. This layer reveals the operational gaps.
3.1. The Backstage View 🔧
Customers see the front stage. They do not see the internal processes that facilitate their request. Mapping the backstage view exposes inefficiencies.
- Internal Handoffs: When does a lead pass from Marketing to Sales? Is information lost in transit?
- System Integrations: Does the CRM update when a support ticket is closed?
- Approval Flows: How long does a refund request sit in the queue?
Often, a customer feels friction because internal teams are working at cross-purposes. Aligning the map with internal workflows ensures that every step the customer takes is supported by a functioning backend.
3.2. Opportunity Identification 💡
Once the map is complete, the next step is opportunity mapping. This involves identifying gaps between the current state and the desired state.
- Quick Wins: Low effort, high impact fixes (e.g., updating a FAQ page).
- Strategic Initiatives: Long-term projects requiring significant investment (e.g., building a new portal).
- Process Improvements: Internal changes that speed up delivery or accuracy.
By categorizing opportunities, you can prioritize resources effectively. This ensures that the map leads to tangible outcomes rather than just insights.
4. Common Pitfalls and How to Avoid Them ⚠️
Many organizations invest in journey mapping but fail to derive value. Understanding what makes a map ineffective is just as important as knowing what makes it effective.
| Characteristic | Ineffective Map | Effective Map |
|---|---|---|
| Data Source | Based on assumptions and opinions. | Based on user research and analytics. |
| Scope | Covers all customers generically. | Focuses on specific personas and scenarios. |
| Ownership | Created by one department (e.g., Marketing). | Collaborative effort across all departments. |
| Format | Static poster or slide. | Living document updated regularly. |
| Focus | Focuses on product features. | Focuses on user needs and emotions. |
One of the most common errors is treating the map as a one-time project. Customer behavior changes. Markets shift. A map created today may be obsolete in six months. Continuous iteration is required to maintain accuracy.
5. Making It Actionable: From Insight to Execution 🚀
The transition from insight to execution is where most journeys stall. To ensure the map is useful, it must be tied to specific actions and accountability.
5.1. Stakeholder Alignment 🤝
Every department must see their role in the journey. Sales needs to know how Marketing qualifies leads. Support needs to know what the product team promised. Alignment prevents silos.
- Workshops: Use the map as a facilitation tool in cross-functional meetings.
- Shared Language: Ensure everyone uses the same terminology for stages and touchpoints.
- Roadmap Integration: Link journey improvements to the product roadmap.
5.2. Defining Success Metrics 📊
You cannot improve what you do not measure. Each stage of the journey should have associated Key Performance Indicators (KPIs).
- Awareness: Traffic sources, brand search volume.
- Consideration: Time on site, content downloads.
- Purchase: Conversion rate, cart abandonment rate.
- Retention: Churn rate, repeat purchase rate.
- Advocacy: Net Promoter Score (NPS), referral rate.
Tracking these metrics against the journey map allows you to see if interventions are working. If a change to the Onboarding process improves retention rates, you have proof of value.
6. The Evolution of the Map: As-Is vs. To-Be 🔄
A robust journey mapping strategy involves two distinct versions of the same document.
6.1. The As-Is Map (Current State) 🛑
This represents the reality of the customer experience right now. It includes all the friction, errors, and inefficiencies. It is honest and unfiltered. This map is used to identify problems and areas for improvement.
6.2. The To-Be Map (Future State) 🏁
This represents the ideal experience you want to deliver. It shows how processes should work, how emotions should feel, and how touchpoints should interact. This map is used for planning and design.
The gap between the As-Is and To-Be maps defines your roadmap. It tells you exactly what needs to change to bridge the divide. This comparison provides a clear direction for strategic investment.
7. Sustaining the Journey Map Culture 🌱
Once the map is built, the work is not finished. It requires a culture of empathy and continuous improvement to remain relevant.
- Regular Reviews: Schedule quarterly reviews to update data and touchpoints.
- New Customer Feedback: Incorporate feedback from new users to identify shifts in behavior.
- Training: Use the map to train new employees on company standards and customer expectations.
- Accessibility: Keep the map accessible to all teams, not just CX leaders.
When the map is embedded in the organizational culture, it stops being a project and starts being a standard operating procedure. Every decision is then evaluated through the lens of the customer journey.
8. Final Thoughts on Utility and Impact 🎯
A great customer journey map is more than a diagram; it is a strategic compass. It guides teams away from internal biases and toward the reality of the customer. By focusing on the anatomy of the map—the persona, the emotion, the touchpoint, and the data—you build a tool that delivers real value.
The utility of the map is measured by the actions it inspires. If your team is making better decisions, if your customers are experiencing less friction, and if your business is growing through improved retention, then the map has served its purpose. It is a living artifact that evolves with your customers, ensuring that your organization remains responsive to their changing needs.
Focus on accuracy over perfection. Focus on collaboration over isolation. Focus on action over analysis. These principles will ensure your journey map remains a cornerstone of your customer experience strategy.

