


Customer Journey Mapping (CJM) has become a staple in the customer experience (CX) toolkit. Yet, too often, these maps end up as digital artifacts—beautiful diagrams stored in shared drives, viewed once during a workshop, and never referenced again. The disconnect lies not in the creation of the map, but in the absence of a mechanism to embed that insight into the daily rhythms of the organization. This guide explores how to transition from static visualization to dynamic integration, ensuring journey maps drive tangible operational changes.
When teams operate in silos, the customer experience fragments. A marketing promise may clash with a support promise, or a product feature might solve a problem that no longer exists. Integrating journey mapping into workflows bridges these gaps. It requires moving from a project-based mindset to a continuous improvement discipline.
1. The Static Trap: Why Maps Gather Dust 🛑
Most journey maps fail because they are treated as deliverables rather than living documents. A map created in a week-long workshop often lacks the context needed for day-to-day decision-making. When a product manager asks, “What feature should we build next?”, a static map cannot answer that question unless it is directly linked to the backlog and prioritization frameworks.
Common reasons for this stagnation include:
- Lack of Ownership: No single team feels responsible for keeping the map current.
- Disconnected Data: The map relies on assumptions rather than real-time behavioral data.
- Infrequent Updates: The map is outdated before it is even published.
- Abstract Metrics: Success is measured by the number of maps created, not by business outcomes.
To break this cycle, the map must be operationalized. It needs to exist where the work happens. For a developer, this might mean a dashboard within the ticketing system. For a marketer, it might mean a checklist within the campaign planning template.
2. From Visualization to Validation: The Shift 🔄
Integration requires a shift in perspective. Instead of viewing the journey map as a representation of “what happened,” view it as a hypothesis of “what will happen” and “what should happen.” This validation loop ensures the map remains relevant.
The process involves three core stages:
- Discovery: Gathering insights through interviews, analytics, and support logs.
- Documentation: Creating the visual representation of the current state.
- Integration: Embedding the insights into workflows, policies, and tooling.
Without the third stage, the effort is merely documentation. With it, the map becomes a strategic asset that guides resource allocation and risk management.
3. Embedding the Map in Teams 🤝
Different departments interact with the customer journey at different touchpoints. To be effective, the journey map must be contextualized for each team. A one-size-fits-all view rarely works for specialized functions.
3.1 Product & Engineering 🛠️
For technical teams, the journey map should translate into user stories and acceptance criteria. Instead of generic requirements, stories should reference specific journey stages.
- Sprint Planning: During sprint planning, teams should reference the “friction points” identified in the journey map.
- Backlog Grooming: Items that reduce friction or remove steps in the journey should be prioritized higher.
- Definition of Done: A feature is not complete if it negatively impacts the overall journey flow.
3.2 Customer Support & Success 📞
Support teams are the first line of defense when the journey breaks. They possess the most direct feedback on where the process fails.
- Ticket Routing: Use journey data to route tickets. A customer in the “Onboarding” stage should be routed to a specialist who understands that specific phase.
- Knowledge Base: Update help articles based on the “friction points” identified in the journey.
- Escalation Paths: Define clear escalation paths for journey breakdowns that require cross-functional intervention.
3.3 Marketing & Sales 📢
Marketing drives the initial promise. If the journey map shows a gap between the promise and the reality, marketing messaging must be adjusted.
- Content Strategy: Create content that addresses specific anxieties or questions identified in the journey stages.
- Lead Qualification: Use journey data to qualify leads based on where they are in the lifecycle, not just demographic data.
- Feedback Loops: Sales teams should report back on why prospects drop off before purchase.
4. The Feedback Loop: Data Integration 🔗
A journey map without data is just an opinion. To maintain accuracy, the map must be fed by continuous data streams. This requires connecting qualitative insights with quantitative metrics.
| Data Source | Integration Point | Impact on Journey Map |
|---|---|---|
| Analytics Tools | Drop-off rates in funnel | Updates the “Pain Points” section of the map. |
| Support Logs | Common ticket themes | Identifies recurring friction in specific stages. |
| Surveys (NPS/CSAT) | Post-interaction sentiment | Validates the emotional state of the customer. |
| Usability Testing | Task completion rates | Highlights usability issues in digital touchpoints. |
By correlating these data sources, teams can validate whether a change to the journey actually improved the experience. For example, if a new checkout process is launched, the journey map should be updated with the new completion rates. If the data shows improvement, the map evolves. If not, the hypothesis is rejected, and a new approach is tested.
5. Metrics that Matter: Connecting Journey to KPIs 📊
Executive leadership often focuses on high-level metrics like Net Promoter Score (NPS). While important, these are lagging indicators. To drive daily workflow changes, teams need leading indicators tied to specific journey stages.
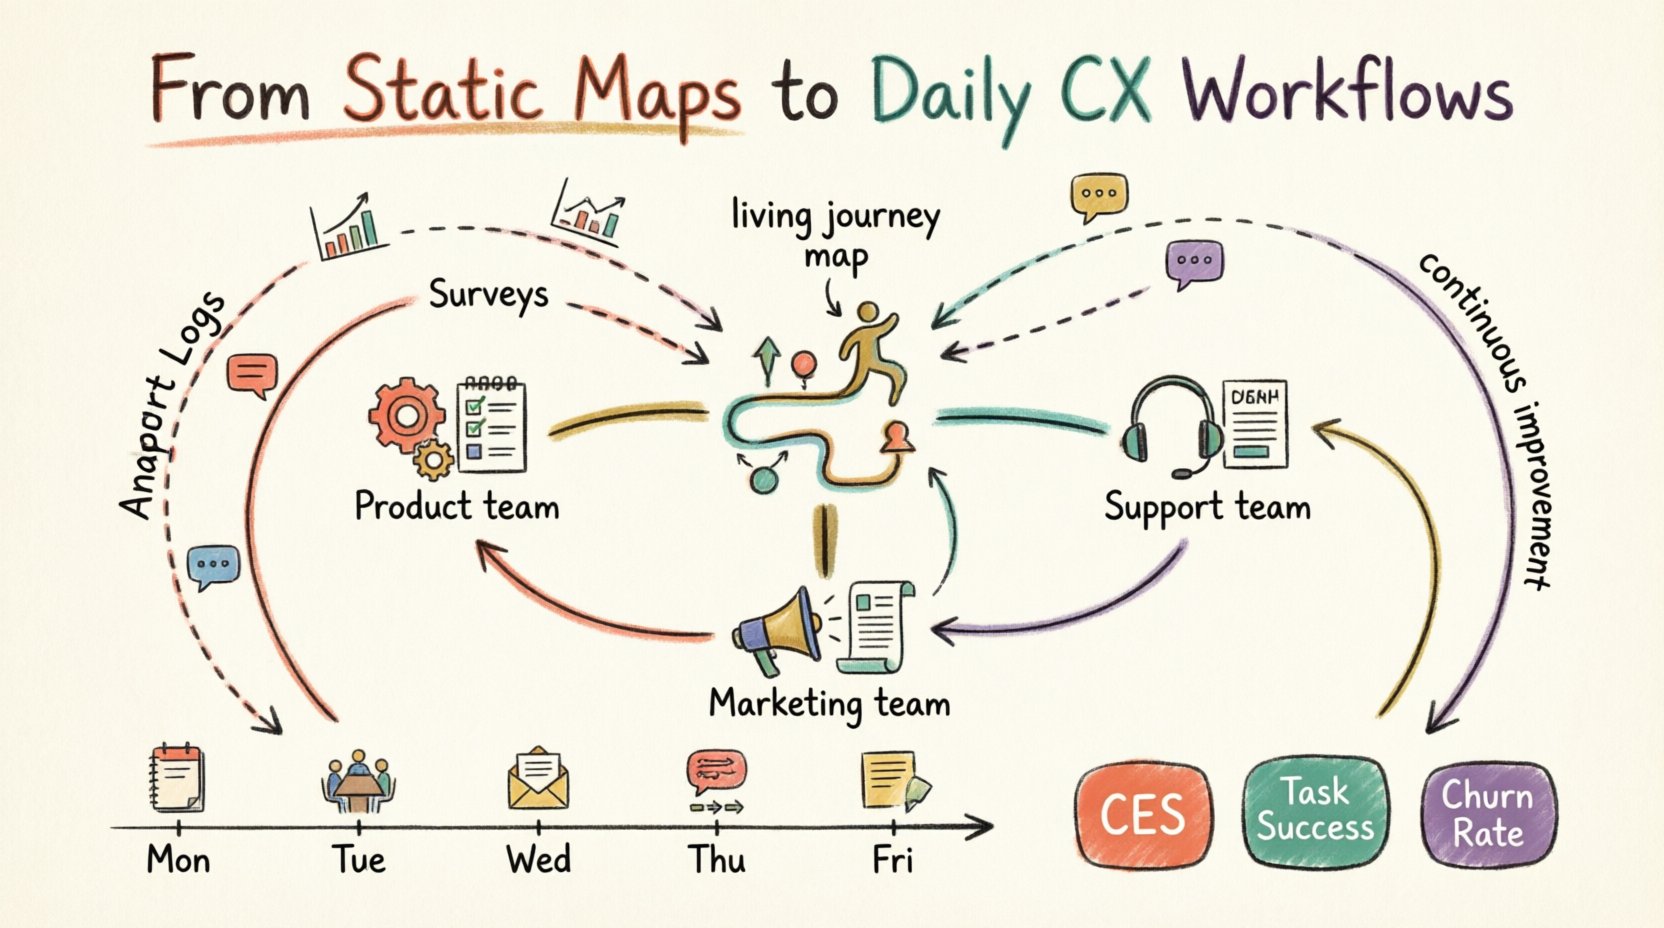
- Customer Effort Score (CES): Measures how easy it is for a user to complete a specific task. Lower effort correlates with higher retention.
- Time to Resolution: Critical for the “Problem Solving” stage of the journey.
- Task Success Rate: The percentage of users who successfully complete a step without assistance.
- Churn Rate by Stage: Identifies exactly where customers leave the ecosystem.
Assigning these metrics to journey stages creates accountability. If the “Onboarding” stage has a high churn rate, the product and success teams share ownership of fixing it. This prevents the “throw it over the wall” mentality.
6. Cultural Shifts Required 🧱
Technical integration is only half the battle. The organizational culture must support continuous journey management. This involves changing how meetings are run and how success is celebrated.
6.1 Empathy as a Skill
Teams need to understand the customer perspective, not just their own role. Regularly involving non-CX staff in customer calls or shadowing sessions reinforces the human element behind the data.
- Shadowing: Have engineers listen to support calls once a month.
- Customer Interviews: Rotate team members to conduct user interviews.
- Walkthroughs: New hires should complete the customer journey themselves.
6.2 Shared Ownership
No single department owns the customer journey. It is a cross-functional responsibility. This requires breaking down silos.
- Joint OKRs: Set Objectives and Key Results that span multiple departments.
- Cross-Functional Squads: Create temporary teams dedicated to optimizing specific journey stages.
- Transparent Dashboards: Share journey metrics openly across the organization.
7. A Weekly Routine for Journey Owners 📅
To keep the map alive, a dedicated rhythm is necessary. A “Journey Owner” or a cross-functional steering committee should manage the lifecycle of the map. Here is a suggested weekly routine:
- Monday: Data Review. Check analytics and support logs for anomalies or spikes in friction.
- Tuesday: Team Sync. Briefly discuss any journey blockers identified in the data with relevant team leads.
- Wednesday: Customer Listening. Review recorded customer calls or chat transcripts for qualitative feedback.
- Thursday: Iteration. Update the journey map with new insights or changes to the process.
- Friday: Retrospective. Review the impact of changes made the previous week. Did the metric move?
This routine ensures the map is not a one-off project but a living system. It prevents the “set and forget” trap.
8. Common Pitfalls and How to Avoid Them ⚠️
Even with the best intentions, teams can stumble. Awareness of common pitfalls helps navigate the integration process smoothly.
| Pitfall | Consequence | Mitigation Strategy |
|---|---|---|
| Map Becomes Too Complex | Teams cannot digest the information. | Create simplified versions for specific teams (e.g., a “Support View” vs. a “Product View”). |
| Lack of Executive Buy-In | Projects stall due to budget cuts. | Link journey improvements directly to revenue or cost savings. |
| Ignoring Internal Journeys | Employee friction impacts customer experience. | Map employee journeys alongside customer journeys. |
| Data Overload | Teams get paralyzed by too many metrics. | Focus on the top 3 critical metrics per stage. |
9. Future-Proofing Your Journey Strategy 🚀
The customer landscape changes rapidly. New channels emerge, and customer expectations evolve. A journey map that works today may be obsolete in six months. Future-proofing involves building flexibility into the process.
- Modular Design: Build maps in modules that can be swapped out without rebuilding the whole structure.
- Automated Monitoring: Set up alerts for when journey metrics deviate from the norm.
- Scenario Planning: Regularly run “what-if” scenarios to prepare for potential disruptions.
- Feedback Agnosticism: Do not rely on a single feedback channel. Aggregate data from multiple sources to avoid bias.
By building flexibility, the organization remains resilient. The journey map becomes a compass rather than a rigid track, guiding the team through changing terrain.
10. Conclusion: A Continuous Discipline 🌱
Integrating customer journey mapping into daily workflows is not a task to be completed. It is a discipline to be maintained. It requires commitment, data, and a willingness to let go of old processes that no longer serve the customer.
When done correctly, the journey map becomes invisible. It is embedded in the tools, the meetings, and the decisions. The organization moves from asking “What does the map say?” to asking “What does the customer need right now?”. That shift is the true measure of success.
Start small. Pick one journey stage. Embed it in one team’s workflow. Measure the impact. Expand. The path to excellence is paved with small, consistent improvements, not grand, one-time gestures.

