


Business Process Model and Notation (BPMN) 2.0 serves as the industry standard for visualizing business processes. For a Business Analyst, understanding this notation is not merely about drawing shapes; it is about translating complex organizational logic into a clear, executable format. This standard ensures that stakeholders, developers, and process owners share a common understanding of how work flows through an organization. 📊
This guide covers the fundamental elements required to model processes effectively. By mastering the syntax and semantics of BPMN 2.0, you ensure that your documentation is precise, actionable, and ready for analysis or implementation without ambiguity. 🧩
1. The Core Building Blocks: Flow Objects 🧱
Every BPMN diagram is constructed from a specific set of elements. These are known as Flow Objects. They form the skeleton of any process model. There are three primary types of flow objects that you must recognize immediately.
- Events: Things that happen during a process. They are represented by circles.
- Activities: Work that is performed. Represented by rounded rectangles.
- Gateways: Points where the process branches or merges based on logic. Represented by diamonds.
Understanding the distinction between these three is critical. Confusing an event with an activity, for instance, can lead to significant errors in process automation logic. Events denote the start or end of a step, whereas activities denote the work itself.
1.1 Events 🟣
Events are the triggers and outcomes of a process. They define when something occurs. There are three distinct categories of events in BPMN 2.0:
- Start Event: Indicates the beginning of a process. It is a circle with a thin outline. There is no incoming flow line for a start event.
- Intermediate Event: Represents an occurrence that happens during the process, between the start and the end. It is a circle with a thick outline. These often represent waiting periods or external triggers.
- End Event: Marks the completion of a process. It is a circle with a thick outline. There is no outgoing flow line for an end event.
For a Business Analyst, specifying the type of event is crucial. A start event might be triggered by a customer placing an order. An intermediate event might be a timer waiting for a document to be approved. An end event signifies the delivery of the final product.
1.2 Activities 🟦
Activities represent the work being done. In BPMN 2.0, these are shown as rounded rectangles. The specific type of work can be refined using sub-categorization.
- User Task: Work performed by a human actor within the system.
- Service Task: Work performed by a system or service (often automated).
- Manual Task: Work performed by a human outside the system.
- Script Task: Work performed by a script or code execution.
When documenting requirements, distinguishing between a User Task and a Service Task is vital. It determines who or what executes the action. A User Task requires human input, while a Service Task implies backend automation.
1.3 Gateways ⬛
Gateways control the divergence and convergence of paths. They are the decision points in a process. Misinterpreting gateway logic is one of the most common errors in process modeling. The following table outlines the most common gateway types.
| Gateway Type | Symbol Shape | Function | Use Case Example |
|---|---|---|---|
| Exclusive Gateway | Diamond with ‘X’ | One path only. Choices are mutually exclusive. | Is the order valid? Yes → Ship. No → Notify. |
| Parallel Gateway | Diamond with ‘+’ | All paths execute simultaneously. | Send email AND update inventory. |
| Inclusive Gateway | Diamond with ‘O’ | One or more paths can execute. | Ship via Air OR Ship via Ground OR Both. |
| Event-based Gateway | Diamond with ‘⚡’ | Waits for an event to occur to determine the path. | Wait for Payment OR Wait for Timeout. |
2. Swimlanes and Responsibility 🏊
A process diagram without context regarding responsibility is often incomplete. BPMN 2.0 uses Pools and Lanes to organize activities by actor. This structure is essential for clarifying roles and handoffs.
- Pool: Represents a major participant in the process, such as an organization or a system. A process usually has at least one pool.
- Lane: Subdivides a pool to represent specific roles, departments, or systems within that participant.
When creating a cross-functional diagram, placing each task in the appropriate lane ensures accountability. If a task sits on the boundary between two lanes, it implies a handoff. This visual cue helps analysts identify potential bottlenecks where information might be lost during transfer.
3. Connecting Objects 🔗
Flow objects need to be connected to show the sequence. The type of connection conveys specific meaning about the interaction between elements.
- Sequence Flow: Solid line with an arrow. Indicates the order of activities. It shows what happens next.
- Message Flow: Dashed line with an open arrow. Represents communication between participants (between pools). It shows information being sent from one entity to another.
- Association: Dotted line. Connects text annotations or artifacts to specific elements to add context without implying flow.
Confusing a Sequence Flow with a Message Flow is a frequent error. Sequence flows stay within a single pool. Message flows cross pool boundaries. Using the correct connector type prevents confusion regarding where data moves within the organization versus where it moves between organizations.
4. Artifacts and Annotations 📝
Not all information fits into the strict flow of events and tasks. BPMN 2.0 provides artifacts to add necessary context without disrupting the logical flow.
- Data Objects: Represent information used or produced by a task. Shown as a page with a folded corner.
- Groups: Visual grouping of elements to clarify scope. Does not affect flow.
- Annotations: Text notes attached to elements to explain requirements or rules.
Using data objects is particularly important for Business Analysts. They define the inputs and outputs required for a task. For example, a “Customer Invoice” data object might be an input for a “Verify Payment” task. This clarifies data requirements for system design.
5. Best Practices for Modeling 📐
To ensure your diagrams are effective, follow these structural guidelines. Consistency is key when presenting models to stakeholders.
5.1 Readability and Layout
- Keep the flow linear where possible. Avoid excessive crossing lines.
- Use consistent colors for different types of processes if you have a style guide.
- Ensure labels are concise. A task label should describe the action, not the result.
- Place text horizontally. Do not rotate labels.
5.2 Naming Conventions
- Use verb-noun format for tasks (e.g., “Approve Request” rather than “Request Approval”).
- Name events descriptively (e.g., “Order Received” rather than “Start”).
- Keep lane names consistent with organizational structure.
5.3 Error Handling
Processes rarely go exactly as planned. A robust model accounts for exceptions. Use intermediate events to capture errors or cancellations. For instance, if a payment fails, there should be a path to a “Notify Customer” task rather than the process ending abruptly.
6. Common Pitfalls to Avoid ⚠️
Even experienced analysts encounter traps when modeling. Awareness of these common mistakes helps maintain quality.
- Over-complication: Trying to model every possible edge case in a single diagram makes it unreadable. Use sub-processes to break down complexity.
- Missing Gateways: Forgetting to define what happens if a condition is not met. Every decision point needs a defined outcome for all possibilities.
- Unbalanced Gateways: If you split a process with a Parallel Gateway, you must join it with a Parallel Gateway. Mismatched gateways can cause logic errors.
- Orphaned Tasks: Ensure every task has a path to an end event. Dead ends confuse stakeholders and break automation logic.
7. Integration with Requirements 📋
BPMN diagrams are not just drawings; they are part of the requirements specification. They bridge the gap between business needs and technical implementation.
- Traceability: Link specific tasks in the diagram to requirement IDs. This ensures every piece of work traces back to a business need.
- Validation: Use the diagram during requirement reviews. Stakeholders often understand visual flows better than text documents. Walk through the process with them to validate logic.
- Automation Readiness: A well-formed BPMN 2.0 model can often be directly imported into workflow engines. This reduces the translation gap between analysis and development.
8. Continuous Improvement 🔄
Processes evolve. A diagram created today may need updates in six months. Maintain version control for your models. Document changes explicitly. When a process changes, update the diagram and notify all stakeholders who rely on that model.
Regular reviews of the process model ensure it remains accurate. Involve process owners in these reviews. Their feedback often reveals nuances that were missed during the initial modeling phase. This collaborative approach keeps the documentation alive and useful.
9. Summary of Key Elements ✅
To recap the essential components for your next modeling session:
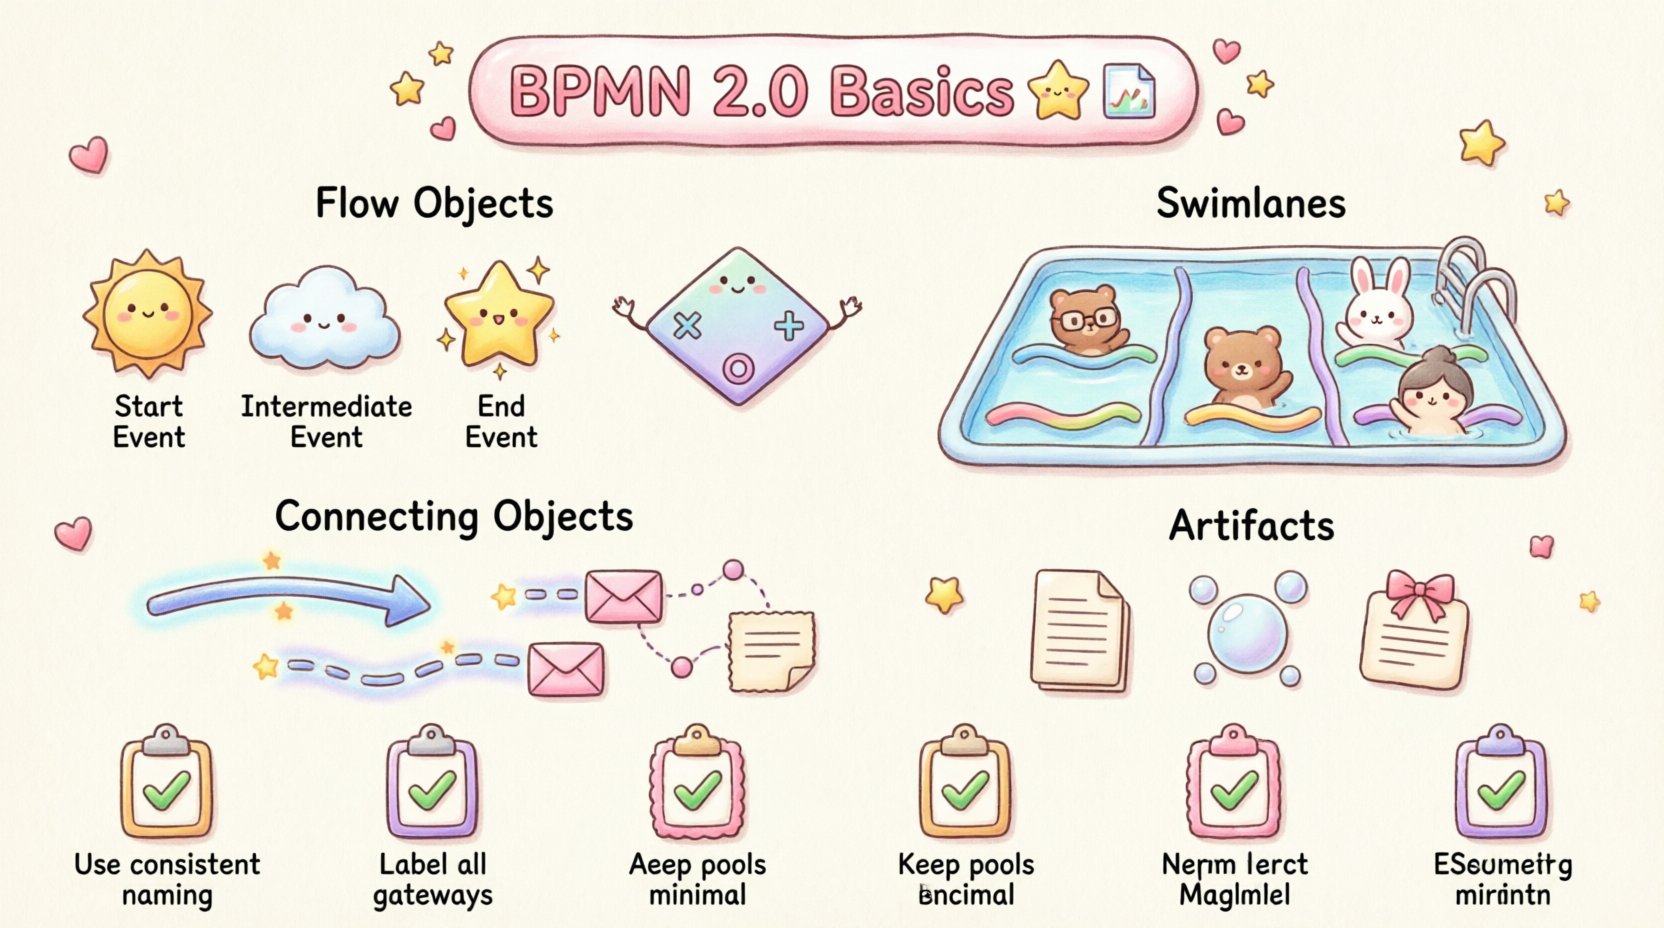
- Flow Objects: Events, Activities, Gateways.
- Swimlanes: Pools and Lanes for responsibility.
- Connectors: Sequence, Message, Association.
- Artifacts: Data, Groups, Annotations.
- Rules: Consistency, Readability, Traceability.
Adhering to these standards creates a professional output that facilitates clear communication. The goal is not just to create a picture, but to create a reliable specification for business operations. By focusing on clarity and accuracy, you provide immense value to the project team and the organization as a whole. 🚀

