
Software architecture often begins on a whiteboard or in a digital diagram tool. However, the journey from a conceptual model to a functioning production environment is fraught with friction. This friction frequently stems from a disconnect between the design phase and the deployment reality. When the deployment diagram is treated as a static artifact rather than a living map, errors propagate into the infrastructure layer.
This guide explores how to construct deployment diagrams that accurately reflect the physical and logical topology of your system. We will examine the mechanics of mapping software components to hardware nodes, ensuring that the intent of the design survives the complexities of implementation.
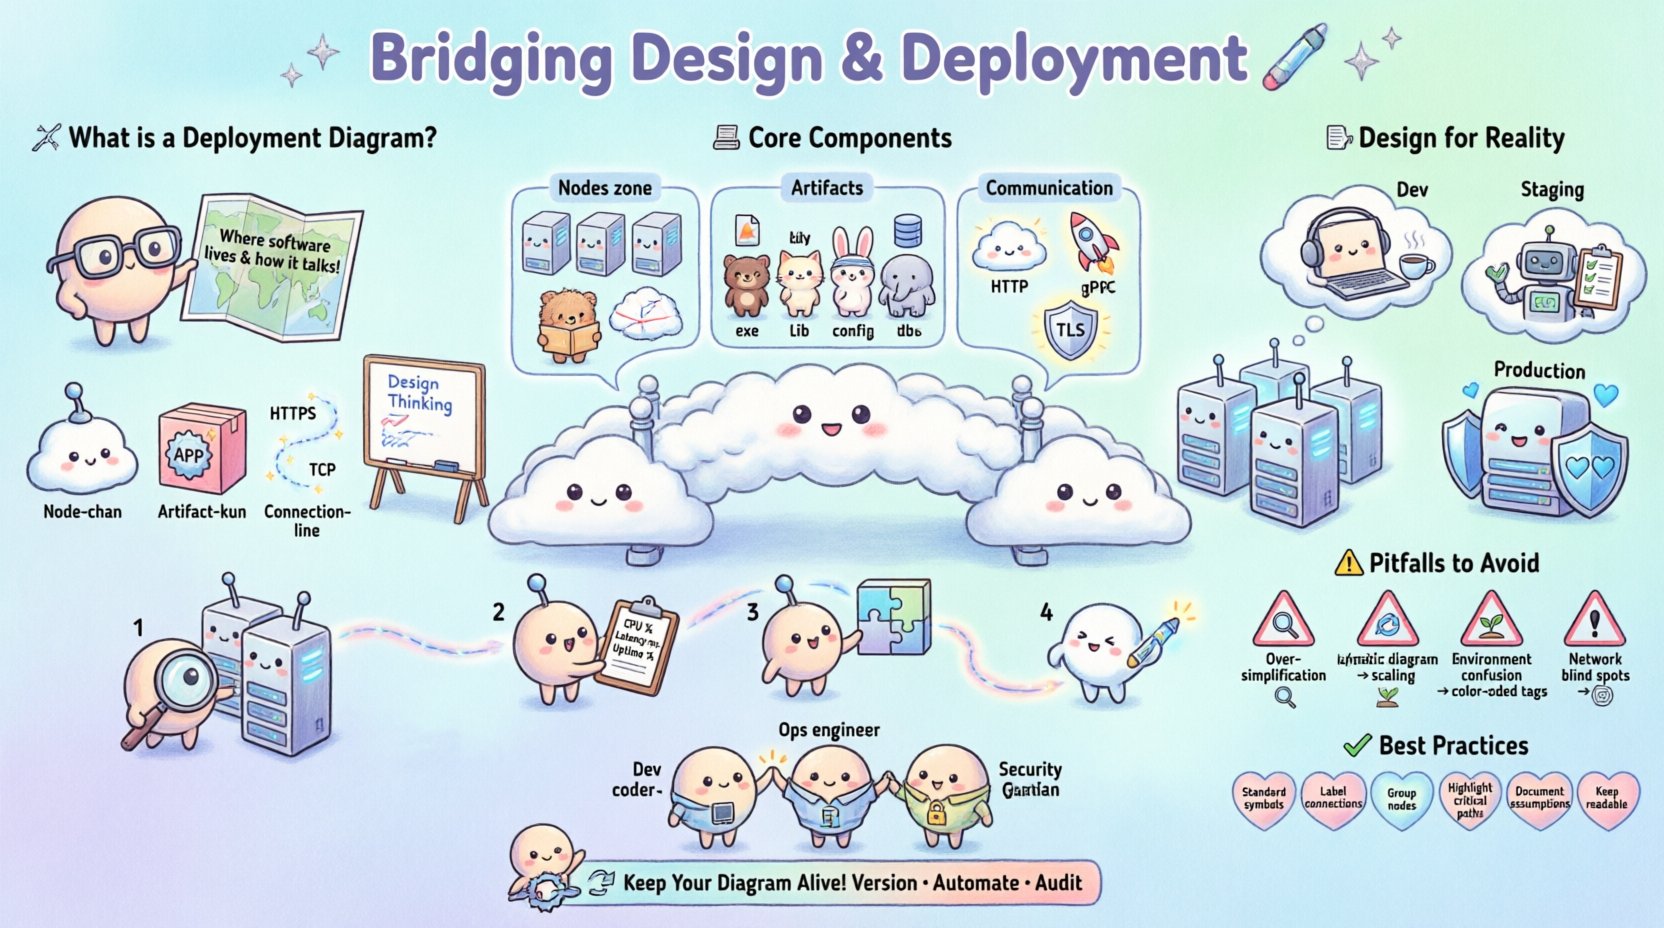
🧩 Understanding the Deployment Diagram
A deployment diagram is a type of UML diagram used to show the physical realization of software artifacts. Unlike class diagrams that focus on code structure, or sequence diagrams that focus on runtime behavior, the deployment diagram focuses on infrastructure. It answers the question: “Where does this software live, and how does it talk to the rest of the world?”
Without a clear deployment strategy, teams often face the following issues:
- Environment Parity Issues: Code works on the developer machine but fails in production due to missing libraries or configuration differences.
- Network Bottlenecks: Components designed to communicate locally are deployed across wide-area networks without considering latency.
- Security Gaps: Sensitive data flows through unsecured channels because the topology was not mapped correctly.
- Scaling Failures: The system cannot handle load because the diagram did not account for load balancers or clustering.
By visualizing the physical nodes and the communication paths between them, architects can identify risks before writing a single line of configuration code.
🏗️ Core Components of a Deployment Diagram
To bridge the gap effectively, one must understand the building blocks used to construct these diagrams. These elements represent the tangible assets of your system.
1. Nodes (Hardware or Virtual)
Nodes represent physical or virtual computing resources. They are the containers for your software. In a modern context, these might not be physical servers but virtual machines, containers, or serverless functions.
- Device Nodes: Physical hardware such as routers, firewalls, or mobile devices.
- Server Nodes: Virtual machines or physical servers hosting applications.
- Container Nodes: Runtime environments like container orchestration clusters.
- Cloud Regions: Abstract nodes representing specific geographic data centers.
2. Artifacts (Software Components)
Artifacts are the software items deployed onto the nodes. These are the tangible outputs of the build process.
- Executables: Compiled binaries or scripts.
- Libraries: Shared dependencies required for runtime.
- Configuration Files: Settings that dictate behavior in specific environments.
- Databases: Data storage instances attached to nodes.
3. Communication Paths
Connections represent the network protocols or channels through which nodes exchange data. These define the trust boundaries and performance characteristics of the system.
- Network Protocols: HTTP, TCP/IP, gRPC, or WebSocket.
- Security Layers: Encrypted tunnels (TLS) or public internet connections.
- Load Balancing: Paths that distribute traffic across multiple nodes.
📐 Designing for Reality
A deployment diagram is only useful if it mirrors the actual infrastructure. Designing for reality requires considering constraints that exist outside the code itself.
1. Environment Parity
One of the most common failures occurs when the development environment differs significantly from production. The diagram should explicitly distinguish between environments.
- Development: Minimal nodes, shared resources, relaxed security.
- Staging: Mirrors production size and configuration for final testing.
- Production: High availability, strict security, redundant paths.
2. Network Topology
Physical location dictates network latency and cost. A diagram must show where nodes are located relative to one another.
- Single Region: Low latency, but risk of total outage if the region fails.
- Multi-Region: High availability and disaster recovery, but higher latency for cross-region calls.
- Hybrid: Some components on-premise, others in the cloud. Requires careful mapping of gateways.
3. Security Boundaries
Security is often an afterthought in design. The diagram should clearly demarcate zones of trust.
- DMZ (Demilitarized Zone): Public-facing servers that act as a buffer.
- Internal Network: Backend services that should never be directly exposed.
- Private Subnets: Database nodes isolated from direct internet access.
🛠️ The Deployment Process Workflow
Creating the diagram is not a one-time event. It is part of a continuous workflow that aligns design with operations.
Step 1: Inventory Existing Assets
Before drawing new paths, catalog what currently exists. This prevents duplicating infrastructure or creating conflicts with legacy systems.
- List all active servers and their roles.
- Identify existing load balancers and their configurations.
- Document current network segmentation rules.
Step 2: Define New Requirements
Based on the business requirements, determine what is needed. This includes performance metrics, availability targets, and compliance needs.
- Throughput: How many requests per second must be handled?
- Latency: What is the acceptable response time?
- Compliance: Are there data residency laws to consider?
Step 3: Map Components to Nodes
Place the software artifacts onto the hardware nodes. Ensure that dependencies are respected. For example, a web server should not be placed on a node that does not have the required runtime library.
Step 4: Validate Communication Paths
Trace the data flow. Does every node have access to the services it needs? Are there any single points of failure? If a node goes down, does the path break completely?
⚠️ Common Pitfalls to Avoid
Even experienced architects make mistakes when visualizing infrastructure. Awareness of these common traps can save significant time and resources.
| Pitfall | Consequence | Mitigation Strategy |
|---|---|---|
| Over-Simplification | Missing hidden dependencies or security gaps. | Include firewall rules and specific protocols. |
| Static Representation | Diagram becomes outdated quickly after deployment. | Link diagram to infrastructure-as-code repositories. |
| Ignoring Scaling | System crashes under load due to missing clusters. | Draw multiple instances behind a load balancer. |
| Environment Confusion | Configuration errors between dev and prod. | Use distinct shapes or colors for different environments. |
| Network Blind Spots | Latency issues or connection timeouts. | Annotate paths with protocol and latency estimates. |
🤝 Collaboration Across Teams
The deployment diagram is a communication tool. It serves as a shared language between development, operations, and security teams.
For Developers
Developers need to know where their code runs to debug issues effectively. The diagram should clearly show:
- Which services are dependent on which databases.
- Where logging and monitoring agents are placed.
- How to access external APIs.
For Operations
Operations teams manage the hardware and network. They need clarity on:
- Resource allocation (CPU, RAM, Storage).
- Backup and restore points.
- Network ports and access control lists.
For Security
Security teams audit for vulnerabilities. The diagram helps them identify:
- Exposed endpoints.
- Data flow across trust boundaries.
- Encryption requirements at rest and in transit.
🔄 Maintenance and Evolution
Infrastructure changes constantly. A deployment diagram that is not maintained becomes a liability. It can mislead new hires or cause deployment failures during migrations.
Versioning the Diagram
Treat the diagram like code. Store it in version control alongside your configuration files. This allows you to track changes over time and revert if necessary.
Automating Updates
Where possible, generate diagrams automatically from the infrastructure definition. This ensures the visual representation always matches the actual state of the system.
Regular Audits
Schedule periodic reviews of the diagram. Ask the following questions:
- Has any new service been added that isn’t documented?
- Are there deprecated components still listed?
- Do the network paths still match the security policy?
✅ Best Practices Checklist
Use this checklist to ensure your deployment diagrams are robust and useful.
- Use Standard Symbols: Adhere to UML standards for nodes and artifacts to ensure universal understanding.
- Label Connections: Always specify the protocol (e.g., HTTPS, TCP) on connection lines.
- Group Related Nodes: Use compartments to group nodes by function (e.g., “Frontend”, “Backend”, “Data Layer”).
- Highlight Critical Paths: Use bold lines or colors to indicate high-priority or high-risk communication channels.
- Document Assumptions: Add notes explaining why certain design choices were made.
- Keep It Readable: Avoid clutter. If the diagram is too large, split it into multiple views (e.g., “Global View”, “Detailed View”).
🌐 Integrating with Broader Architecture
A deployment diagram does not exist in isolation. It connects to the broader system architecture.
Relationship to Component Diagrams
While the component diagram shows internal structure, the deployment diagram shows external placement. Ensure that the components in the first diagram are correctly mapped to the artifacts in the second.
Relationship to Sequence Diagrams
Sequence diagrams show the timing of interactions. The deployment diagram provides the context for those interactions. If a sequence diagram shows a call across a network, the deployment diagram should show the physical path.
🔒 Security Considerations in Design
Security must be baked into the design, not added later. The deployment diagram is the primary tool for visualizing security posture.
- Isolation: Ensure sensitive services are placed on nodes that are not accessible from the public internet.
- Encryption: Mark all connections that carry sensitive data with encryption indicators.
- Authentication: Document where authentication gateways are placed in the flow.
- Monitoring: Ensure every node has a path to a central logging or monitoring service.
📈 Scaling Strategies
Designing for scale requires specific patterns visible in the deployment diagram.
Horizontal Scaling
Adding more nodes to handle increased load. The diagram should show multiple instances of the same service behind a load balancer.
Vertical Scaling
Increasing the resources of a single node. The diagram should note resource limits (CPU/RAM) for each node type.
Database Scaling
Separating read and write operations. The diagram should distinguish between primary and replica database nodes.
🏁 Final Thoughts
Bridging the gap between design and deployment requires discipline and clarity. The deployment diagram serves as the contract between the architect and the operator. When created with precision, it reduces risk, improves communication, and accelerates delivery.
By focusing on the physical reality of your infrastructure, you ensure that your software performs as intended. Treat the diagram not as a static drawing, but as a dynamic map that evolves with your system. This approach leads to more resilient, secure, and maintainable software architectures.
Remember that the goal is not perfection in the drawing, but accuracy in the understanding. Use these diagrams to facilitate conversation, validate assumptions, and guide the implementation of complex systems.

