


Building software infrastructure is rarely a solitary endeavor. It involves a complex tapestry of developers, operations engineers, security specialists, and product managers working in concert. To ensure everyone understands how the system fits together in production, deployment modeling serves as a critical communication tool. This guide explores how cross-functional teams can effectively create, maintain, and utilize deployment diagrams without relying on specific proprietary tools. The goal is to establish a shared understanding of the system architecture that withstands the pressure of rapid change and high availability requirements. 🛠️
🤝 The Importance of Shared Architectural Vision
When a team operates in silos, the deployment landscape often becomes fragmented. Developers may design services that are difficult to host, while operations teams may restrict resources that are essential for performance. Deployment modeling bridges this gap by providing a visual contract between these disciplines. It is not merely about drawing boxes and lines; it is about defining boundaries, data flows, and trust zones.
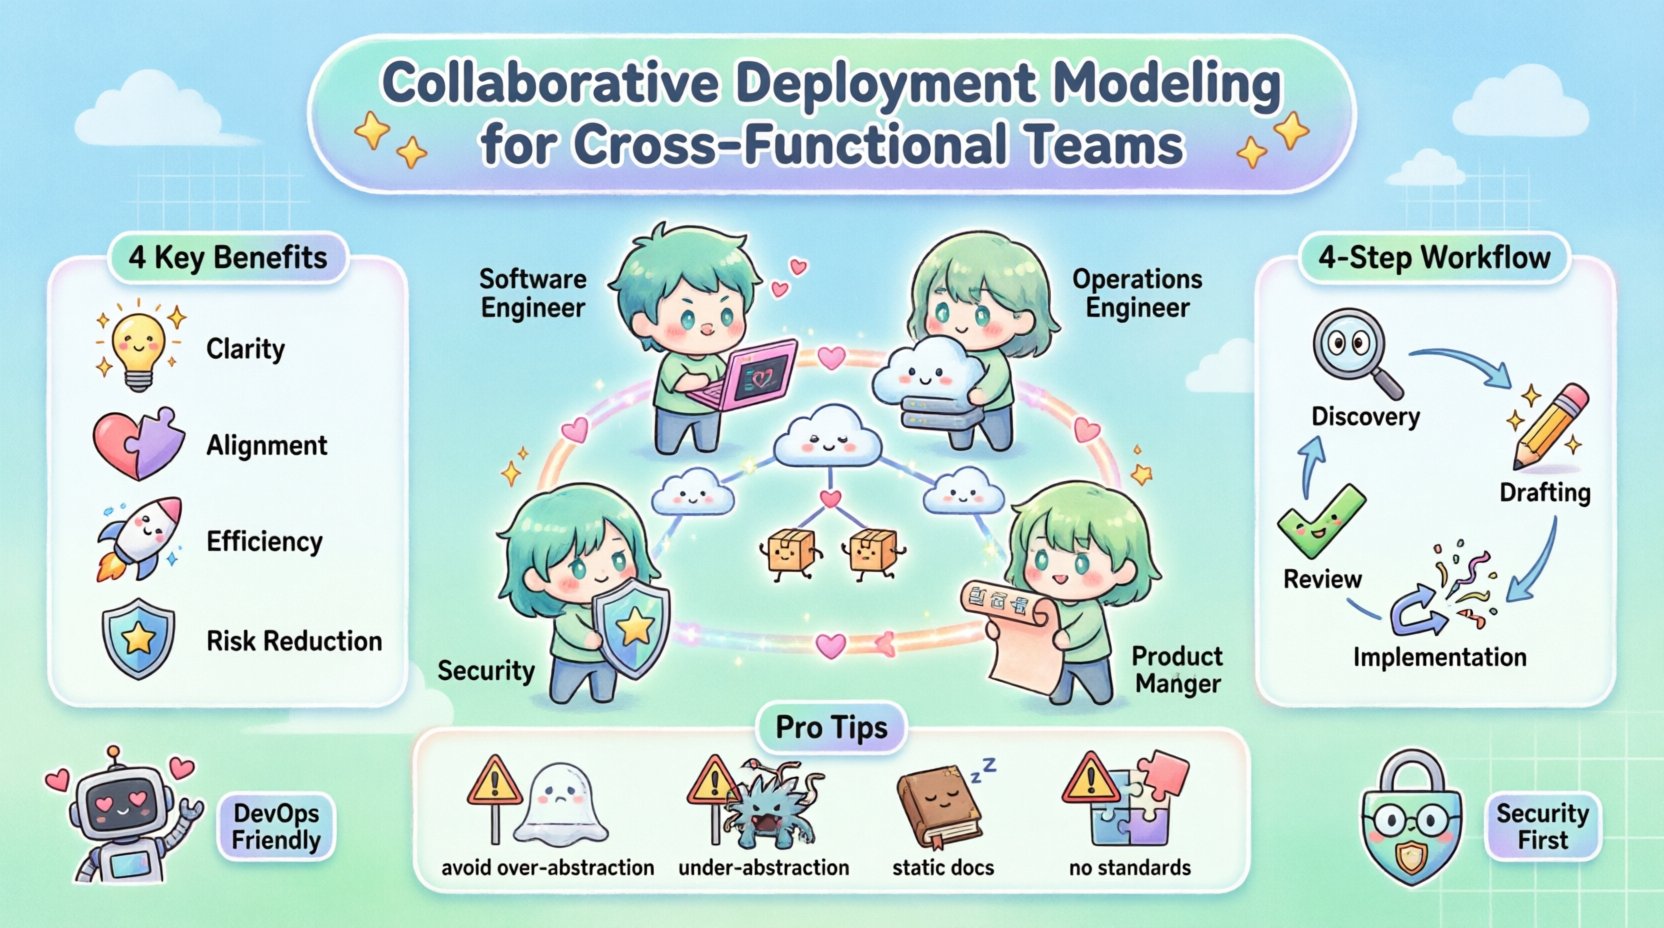
- Clarity: A clear diagram reduces ambiguity regarding where components reside.
- Alignment: It ensures that security, performance, and functional requirements are met in the target environment.
- Efficiency: Reduces back-and-forth communication during the release cycle by pre-identifying infrastructure needs.
- Risk Reduction: Visualizing dependencies helps identify single points of failure before they impact the live environment.
Without a collaborative approach, diagrams often become outdated artifacts that sit in a documentation folder, ignored until an incident occurs. The value lies in the act of creating the model together, not just the final image. This process forces stakeholders to articulate assumptions and challenge constraints early in the design phase. 🧠
📐 Understanding Deployment Diagrams in a Modern Context
A deployment diagram represents the physical or virtual hardware on which software runs. In modern environments, this often includes cloud instances, container orchestrators, and managed services rather than physical servers. The diagram maps the software artifacts to the hardware nodes, showing how they communicate.
Key Components of a Deployment Model
- Nodes: These represent the physical or virtual computing resources. They can be classified as devices, execution environments, or clouds.
- Artifacts: The software components being deployed, such as executables, libraries, or configuration files.
- Connections: The communication channels between nodes and artifacts. This includes network protocols, APIs, and message queues.
- Interfaces: The points of interaction where one component connects to another.
When modeling for cross-functional teams, the level of abstraction must be agreed upon. A high-level view is necessary for product managers to understand capacity, while a low-level view is essential for engineers configuring networking rules. Balancing these views requires a layered approach. 📊
👥 Defining Roles and Responsibilities
Successful collaboration requires clear ownership. When multiple disciplines contribute to the model, confusion can arise regarding who updates what. The following table outlines typical responsibilities during the modeling phase. This structure helps prevent bottlenecks where one person becomes the gatekeeper for all architectural decisions.
| Role | Primary Contribution | Review Focus |
|---|---|---|
| Software Engineers | Defines application components and internal logic | Resource requirements and API exposure |
| Operations Engineers | Defines infrastructure nodes and networking | Scalability and maintenance windows |
| Security Specialists | Defines trust zones and encryption needs | Access controls and compliance |
| Product Managers | Defines user-facing flows and capacity goals | Cost implications and delivery timelines |
By assigning specific review focuses, the team ensures that the diagram satisfies all non-functional requirements without requiring every stakeholder to understand every technical detail. This specialization maintains quality while keeping the collaboration manageable. 🔒
🔄 The Collaborative Modeling Workflow
The process of building the deployment model should not be a one-time event. It is an iterative cycle that evolves with the product. A structured workflow ensures that changes are tracked and communicated effectively.
1. Discovery and Alignment
Before drawing any lines, the team must agree on the scope. What is the boundary of the system? Which external services are in scope? This phase involves workshops where stakeholders map out their current pain points. Questions to address include:
- What are the current deployment targets?
- Are there legacy constraints that affect new components?
- What are the expected traffic patterns during peak usage?
- Who is responsible for the data persistence layer?
Documenting these answers creates a foundation for the diagram. It ensures that the model reflects reality rather than an idealized vision. 🗺️
2. Drafting the Architecture
During this phase, engineers create the initial structure. It is crucial to use a collaborative environment where multiple users can edit or comment simultaneously. This prevents version conflicts where two people edit the same file. The draft should focus on the core infrastructure first, then layer in the application logic.
- Start with Nodes: Place the servers, containers, or cloud regions.
- Add Artifacts: Place the microservices or applications on the nodes.
- Draw Connections: Establish the data paths between components.
- Annotate: Add labels for protocols (e.g., HTTPS, gRPC) and ports.
3. Review and Validation
Once the draft is complete, it enters a review cycle. This is not a passive reading phase. Each role must validate the model against their constraints. Security checks for open ports, operations checks for load balancing, and engineering checks for latency requirements. Feedback should be specific and actionable.
For example, instead of saying “This looks wrong,” a reviewer should state, “The database node does not have a secondary region for disaster recovery.” This specificity drives the next iteration of the model. ✅
4. Implementation and Synchronization
The diagram must remain synchronized with the actual infrastructure. If the diagram is not updated when changes occur, it loses credibility. Teams should treat the diagram as code. Changes to the infrastructure should trigger updates to the diagram as part of the deployment pipeline. This practice, often called “Infrastructure as Documentation,” ensures that the visual model is always current. 🔄
⚠️ Managing Conflicts and Dependencies
Conflict is inevitable when different teams have competing priorities. Engineering might want a specific database for performance, while security might mandate a different solution for compliance. The deployment diagram becomes the neutral ground where these conflicts are resolved visually.
Resolving Resource Contention
When multiple services require the same resource, the diagram highlights the bottleneck. For instance, if two microservices share a single database node, the diagram clearly shows that this is a potential single point of failure. The team can then decide to:
- Split the services onto separate nodes.
- Implement a load balancer in front of the database.
- Introduce a caching layer to reduce load.
By visualizing the contention, the team can make data-driven decisions rather than guessing. The diagram acts as a simulation of the system’s physical constraints. 💥
Handling External Dependencies
Systems rarely exist in isolation. Third-party APIs, legacy mainframes, and partner services are common external nodes. Modeling these dependencies is critical for understanding failure modes. If an external API goes down, does the entire system fail, or is there a fallback mechanism? The diagram should indicate these fallback paths clearly.
Teams should define the “Trust Boundary” around external services. Does the external service have access to internal credentials? Is the connection encrypted? These details are essential for security reviews and must be visible on the diagram. 🔗
📈 Maintenance and Lifecycle Management
A deployment model is a living document. It requires maintenance to remain useful. Without a governance strategy, diagrams become obsolete within months. The following practices help maintain the integrity of the model over time.
- Version Control: Store the model definition in a version control system. This allows the team to see who made changes and when.
- Change Logs: Every modification to the diagram should be linked to a ticket or change request. This provides context for why a change was made.
- Regular Audits: Schedule quarterly reviews to verify that the diagram matches the running system. This is especially important after major refactoring efforts.
- Onboarding Tool: Use the diagram as a primary reference for new team members. It accelerates understanding of the system’s structure.
Assigning a “Diagram Owner” can help. This person is responsible for ensuring the model stays up-to-date. However, ownership should not mean isolation. The owner facilitates updates from all contributors. 👷
🚧 Common Pitfalls to Avoid
Even with the best intentions, teams often fall into traps that reduce the value of the deployment model. Recognizing these pitfalls early can save significant time and effort.
Over-Abstraction
Creating a diagram that is too high-level can hide critical details. If a team only draws “Server” boxes without distinguishing between web servers and application servers, the operations team cannot plan for scaling. The diagram must be detailed enough to be actionable but simple enough to be readable. ⚖️
Under-Abstraction
Conversely, including every single configuration file or minor script can clutter the diagram. The focus should be on the structural components that affect deployment and runtime, not the implementation details. Keep the view relevant to the infrastructure. 🧹
Static Documentation
The most common error is creating a static document that is never updated. If the infrastructure changes but the diagram does not, the diagram becomes a liability. It may lead engineers to assume the system is stable when it is not. Treat the diagram as executable code or configuration, not just a picture. 📉
Lack of Standardization
If different teams use different symbols or notation styles, the model becomes difficult to read. Establish a standard notation early on. Decide how to represent databases, firewalls, and queues. Consistency reduces cognitive load when reading the model. 📏
🔍 Measuring the Success of the Model
How do you know if the collaborative deployment modeling is working? It is not enough to simply have a diagram. You need metrics that indicate improved collaboration and reduced friction.
- Deployment Frequency: Does the team deploy more often? A clear model reduces fear of change, potentially increasing velocity.
- Incident Resolution Time: Does it take less time to diagnose infrastructure issues? A good diagram speeds up root cause analysis.
- Documentation Coverage: What percentage of the system is covered by the model? Aim for 100% coverage of critical paths.
- Team Satisfaction: Survey the team on whether the model helps them understand the system better. Feedback is qualitative but vital.
Tracking these metrics helps justify the time spent on modeling. It shifts the perception from “documentation overhead” to “operational asset.” 📈
🌐 Integrating with DevOps Practices
Deployment modeling fits naturally into DevOps workflows. It supports the concept of Continuous Integration and Continuous Deployment (CI/CD) by providing the blueprint for the pipeline. When a change is proposed, the model can be used to simulate the impact on the infrastructure.
Automated tools can sometimes validate the diagram against the infrastructure state. For example, a script can check if the nodes listed in the diagram actually exist in the cloud account. This validation loop ensures that the model and reality remain aligned. Automation reduces the manual effort required to keep the model accurate. 🤖
Furthermore, the diagram can inform the definition of “Infrastructure as Code” (IaC). The visual model serves as the source of truth for the code that provisions the infrastructure. This alignment ensures that the code matches the design intent. 🔨
🛡️ Security and Compliance Considerations
Security teams often struggle to get a clear view of the deployment landscape. A collaborative model that includes security annotations helps bridge this gap. Specific security controls should be marked on the diagram.
- Encryption: Indicate where data is encrypted in transit and at rest.
- Authentication: Show where identity verification occurs.
- Network Segmentation: Highlight firewalls and subnets that isolate sensitive data.
- Compliance Zones: Mark areas where specific regulations (e.g., GDPR, HIPAA) apply.
By embedding security into the visual model, compliance audits become less burdensome. The diagram serves as evidence of the security posture. This proactive approach prevents security from being a bottleneck at the end of the development cycle. 🛡️
🤝 Conclusion
Collaborative deployment modeling is a strategic investment in system reliability and team efficiency. It requires discipline, consistent communication, and a commitment to keeping the model current. By involving all relevant stakeholders in the creation and maintenance of the diagram, teams create a shared language that transcends technical specialties. This shared understanding reduces friction, accelerates delivery, and improves the overall resilience of the software system. The effort invested in modeling pays dividends in every deployment and every incident response. 🚀
")
