


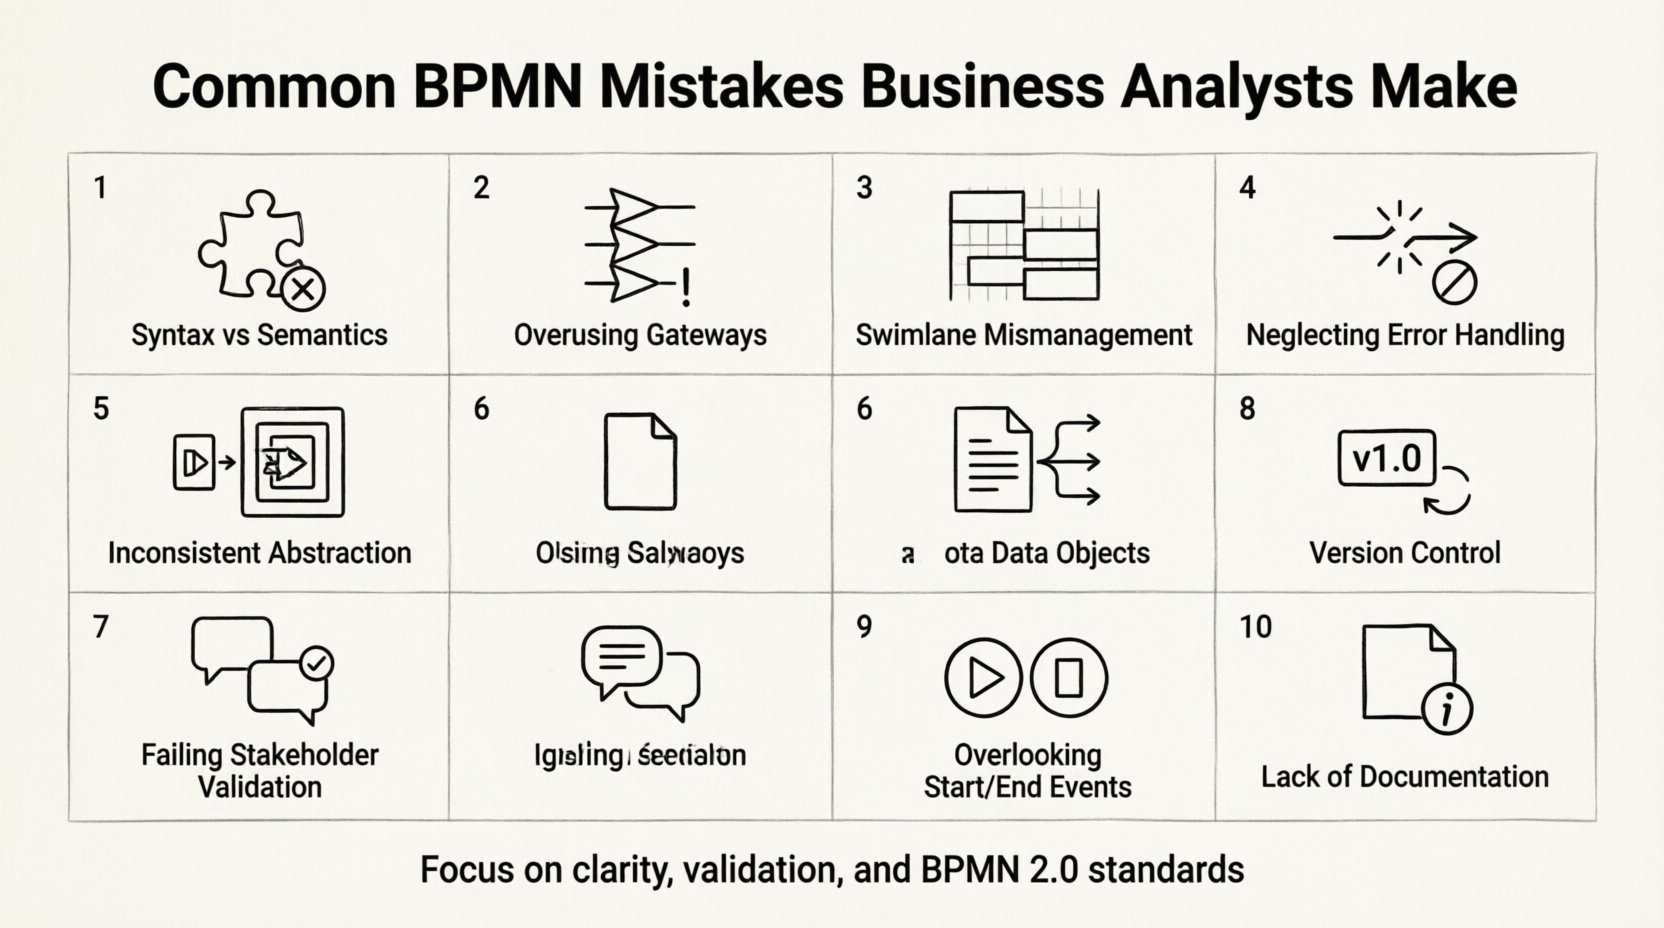
Business Process Model and Notation (BPMN) serves as the universal language for process modeling. It bridges the gap between technical teams and business stakeholders by providing a standardized visual representation of workflows. However, despite its widespread adoption, the accuracy and utility of these models often suffer from preventable errors. As a Business Analyst, understanding the nuances of BPMN 2.0 is critical. Many practitioners fall into traps that compromise the integrity of the process documentation. This article explores the most frequent mistakes made during process modeling and outlines how to avoid them for robust, actionable diagrams.
When creating process maps, the goal is clarity, not complexity. A well-constructed diagram should allow a reader to understand the flow of activities without needing a dictionary. Yet, many models become unreadable quickly. Below, we break down the specific areas where errors typically occur, supported by industry standards and practical insights.
1. Confusing Syntax with Semantics 🧩
One of the most pervasive errors involves prioritizing how a shape looks over what it actually represents. Syntax refers to the visual rules—where to place a gateway or how to connect a task. Semantics refer to the meaning behind those shapes. A common pitfall is using a shape because it looks “correct” rather than because it fits the logic of the process.
- Incorrect: Using a Task shape to represent a decision point.
- Correct: Reserving Gateways exclusively for decision logic.
- Incorrect: Connecting two Gateways directly without an intermediate activity.
- Correct: Ensuring every Gateway connects to an Activity or Event.
When semantics are ignored, the diagram becomes ambiguous. A stakeholder might interpret a specific path as mandatory when it is actually optional. This leads to misaligned expectations during the implementation phase. Always verify that every symbol adheres strictly to the BPMN 2.0 specification.
2. Overusing Gateways 🚫
Gateways control the flow of the process. While essential, they are often overused to the point where the diagram becomes cluttered. Some analysts attempt to model every single condition using a gateway, resulting in a “spaghetti diagram” that is difficult to follow.
Consider the following best practices regarding gateways:
- Exclusive Gateways (XOR): Use only when exactly one path out of several is taken.
- Inclusive Gateways (OR): Use when multiple paths can be taken simultaneously.
- Parallel Gateways (AND): Use to split or merge concurrent flows.
Excessive use of XOR gateways can make a process appear more complex than it is. If a decision is simple, a single condition on a sequence flow might suffice. If a condition is too complex, consider breaking it into a sub-process. This keeps the high-level view clean while allowing detailed logic to exist elsewhere.
3. Swimlane Mismanagement 📊
Swimlanes define the responsibility for activities. They are crucial for showing who does what. However, analysts often create too many swimlanes or organize them poorly. This results in a horizontal or vertical expansion that forces the reader to scroll excessively.
Common issues include:
- Too many lanes: Creating a lane for every single role can fragment the process. Group roles into broader categories if possible.
- Inconsistent ordering: Ensure swimlanes are ordered logically, such as by department or hierarchy, and keep that order consistent across multiple diagrams.
- Orphaned tasks: A task placed in a lane that does not belong to it creates confusion.
When a process involves multiple systems or departments, clarity is paramount. If a diagram becomes too wide, consider using a collapsed sub-process to handle the complexity of a specific department. This maintains the main flow while delegating detailed responsibility to a secondary view.
4. Neglecting Error Handling and Exception Flows 🛑
Most process models depict the “Happy Path”—the ideal scenario where everything goes right. However, real-world processes rarely function without interruptions. Failing to model error paths, retries, or exceptions renders the model incomplete.
Analyze the process for potential failure points:
- System Failures: What happens if the API times out?
- Human Errors: What if the data entry is incorrect?
- Policy Violations: What happens if a user does not meet the criteria?
Using Error Events or Message Events to handle these exceptions ensures the model reflects reality. Without these paths, stakeholders may assume the process is robust when it is actually fragile. Always ask: “What happens if this step fails?” and model the response.
5. Inconsistent Abstraction Levels 📈
Process modeling requires different levels of detail for different audiences. A strategic view should show high-level phases, while a tactical view should show specific system interactions. Mixing these levels in a single diagram creates confusion.
Adhere to a clear scope:
- Level 1 (Context): High-level entry and exit points.
- Level 2 (Process): Major phases and key decisions.
- Level 3 (Activity): Detailed steps and data objects.
Do not include system screen clicks in a high-level process map. Conversely, do not omit critical data validations in a detailed implementation map. Consistency ensures that the model remains useful for its intended purpose. If you need to show both levels, use sub-processes to encapsulate the lower level.
6. Ignoring the Role of Data Objects 📄
Processes do not happen in a vacuum; they manipulate data. Many diagrams focus entirely on tasks and ignore the information being created, read, or updated. This omission makes it difficult to trace data lineage or identify data bottlenecks.
Integrate Data Objects effectively:
- Input Objects: Show what data is required to start a task.
- Output Objects: Show what is produced by the task.
- Reference Objects: Show data that is read but not changed.
By explicitly modeling data, you bridge the gap between process flow and system requirements. Developers can use these objects to design database schemas or API payloads. Stakeholders can verify that the correct information is being captured at the right time.
7. Failing to Validate with Stakeholders 🗣️
A diagram is not complete until it has been reviewed by the people who execute the process. Many analysts build the model in isolation and present it as finished work. This leads to a disconnect between the model and reality.
Validation strategies include:
- Walkthroughs: Walk through the process step-by-step with a user.
- Simulation: If possible, test the logic against real scenarios.
- Feedback Loops: Allow time for stakeholders to review and correct the model before finalizing.
Without validation, the model is merely an assumption. The goal is to capture the actual process, not the perceived process. Regular feedback ensures the model remains accurate as the business evolves.
Common Mistakes vs. Best Practices Table 📋
The following table summarizes the key distinctions between common errors and recommended approaches.
| Area | Common Mistake | Best Practice |
|---|---|---|
| Gateways | Using too many decision points | Consolidate logic where possible |
| Swimlanes | Too many lanes causing clutter | Group roles by function |
| Errors | Only showing the happy path | Model exception flows explicitly |
| Detail | Mixing high-level and detailed views | Use sub-processes for abstraction |
| Data | Ignoring information objects | Link data to specific tasks |
| Validation | Assuming the model is correct | Verify with process owners |
8. Version Control and Change Management 🔄
Processes evolve. Requirements change, and the model must reflect those changes. A common mistake is treating the diagram as a static artifact. Without versioning, it becomes difficult to track what changed, why it changed, and when the change occurred.
Implement a clear change management protocol:
- Version Numbering: Use a standard format (e.g., v1.0, v1.1) for all diagrams.
- Change Logs: Document what was modified and who approved the change.
- Impact Analysis: Assess how a change affects downstream processes before applying it.
This discipline ensures traceability. When a question arises about a specific process behavior, you can trace it back to the version that introduced that logic. This is essential for compliance and audit requirements.
9. Overlooking the Start and End Events ⏱️
Every process must have a defined beginning and end. However, analysts sometimes leave processes open-ended or use multiple start/end events without clear context. This makes it impossible to determine the scope of the process.
Ensure clear boundaries:
- Start Event: Define the trigger that initiates the process.
- End Event: Define the successful completion of the process.
- Intermediate Events: Use these for messages or timers within the flow.
Using multiple start events can imply multiple triggers. Ensure these are intentional and clearly labeled. Similarly, multiple end events can indicate different outcomes (Success vs. Failure). Distinguish between a “Cancel” end event and a “Complete” end event to provide clarity on the result.
10. Lack of Contextual Documentation 📝
A diagram is a visual aid, not a standalone manual. Without accompanying text, the model may lack necessary context. This is particularly true for complex business rules or regulatory requirements.
Include supporting documentation:
- Glossary: Define terms used in the diagram.
- Notes: Add text annotations to explain complex logic.
- Dependencies: List external systems or data sources required.
Documentation acts as the anchor for the visual elements. It provides the “why” behind the “what”. This reduces the cognitive load on the reader and ensures that the model is understood correctly across the organization.
Final Thoughts on Process Modeling Quality 💡
Creating a high-quality BPMN diagram requires more than just knowing the shapes. It requires a deep understanding of the business logic, the organizational structure, and the technical constraints. By avoiding the common pitfalls discussed above, Business Analysts can produce models that are not only visually appealing but also functionally accurate.
Focus on clarity over complexity. Prioritize the user’s ability to understand the flow. Treat the diagram as a living document that requires validation and maintenance. When these principles are applied consistently, the result is a robust foundation for process improvement and system development.
Remember, the goal is to facilitate communication. If the diagram is confusing to the reader, it has failed its primary purpose. Regular review, adherence to standards, and stakeholder collaboration are the keys to success. By refining these skills, analysts can significantly enhance the efficiency and reliability of their process management efforts.
Continual learning is essential. As BPMN standards evolve, so should your modeling techniques. Stay updated on the latest specifications and community best practices. This commitment to quality ensures that your work remains relevant and valuable in a changing business landscape.

