


Understanding the path a customer takes from initial awareness to post-purchase loyalty is fundamental to modern business strategy. Customer journey mapping provides the blueprint for this understanding. It transforms abstract data into a visual narrative that highlights friction, opportunity, and emotion. This guide addresses the critical questions organizations face when implementing this discipline.
❓ What is customer journey mapping exactly?
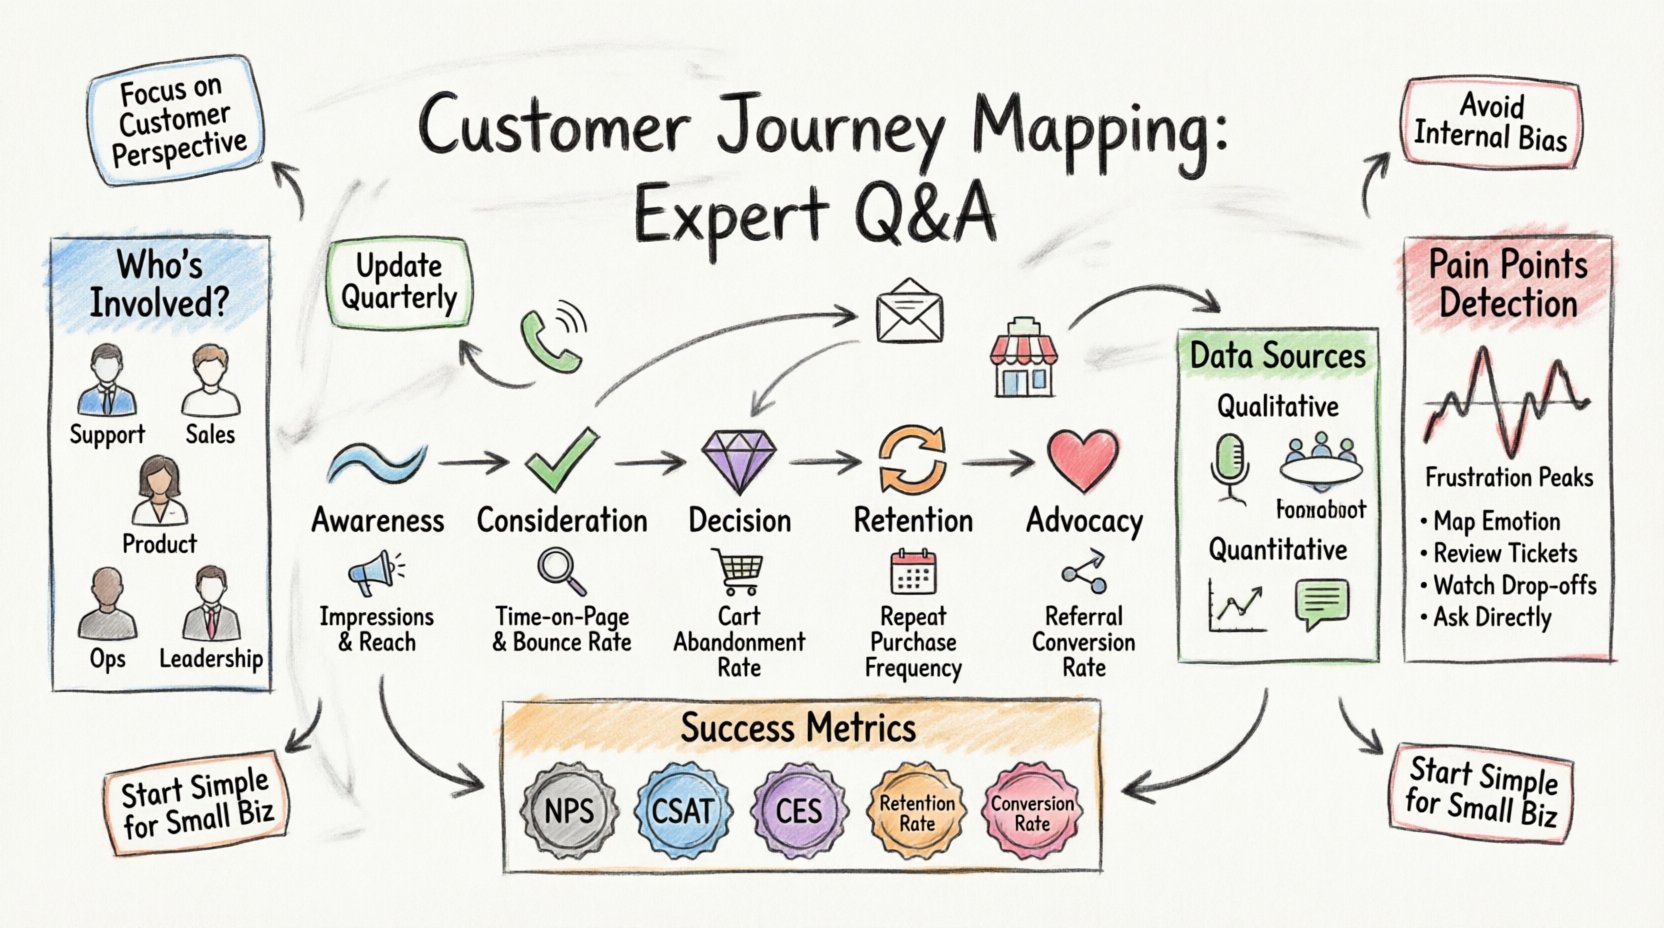
Customer journey mapping is the practice of visualizing the end-to-end experience a customer has with a brand. It is not merely a list of touchpoints; it is a story told from the customer’s perspective. The map illustrates the steps a person takes, the channels they use, and the feelings they experience at each stage.
- Scope: It covers the entire lifecycle, not just the sales cycle.
- Perspective: It focuses on the user, not the internal organization.
- Output: It results in actionable insights for improvement.
Unlike a standard flowchart that dictates how a process should work, a journey map reflects how the process actually feels for the user. It identifies gaps between what the customer expects and what they receive.
👥 Who needs to be involved in the mapping process?
Creating an accurate map requires input from across the organization. Relying solely on the marketing team creates a biased view. A cross-functional approach ensures the map reflects reality.
- Customer Support: They hear the complaints and questions first-hand.
- Sales: They understand the objections and closing hurdles.
- Product Development: They know the technical constraints and features.
- Operations: They manage the logistics and fulfillment.
- Executive Leadership: They provide the budget and strategic alignment.
When different departments collaborate, silos break down. The map becomes a shared document that aligns everyone toward a common customer-centric goal.
📊 What are the standard stages of a customer journey?
While industries vary, most journeys follow a general progression. Breaking the journey into stages helps teams focus on specific behaviors and goals at each point.
| Stage | Primary Goal | Key Metric |
|---|---|---|
| Awareness | Discovery | Reach / Impressions |
| Consideration | Evaluation | Engagement / Click-through |
| Decision | Conversion | Conversion Rate |
| Retention | Usage / Satisfaction | Churn Rate / Usage Frequency |
| Advocacy | Referral | NPS / Referral Rate |
It is important to note that modern journeys are rarely linear. A customer might loop back from the decision stage to consideration if they encounter an issue. The map must accommodate these non-linear paths.
🔍 How do you gather the necessary data?
Data collection is the foundation of an accurate map. Relying on assumptions leads to maps that look good but fail in practice. You need a mix of qualitative and quantitative data sources.
Qualitative Data
- Interviews: One-on-one conversations with customers about their experiences.
- Focus Groups: Group discussions to uncover shared sentiments.
- Observation: Watching users interact with products or services in real-time.
- Feedback Forms: Open-ended questions allowing customers to express thoughts freely.
Quantitative Data
- Analytics: Website traffic, drop-off rates, and session duration.
- Surveys: Structured data collection on satisfaction and likelihood to recommend.
- Transaction Logs: Records of purchases, returns, and support tickets.
- Social Listening: Monitoring public sentiment on social platforms.
Combining these sources creates a holistic view. Numbers tell you what is happening; stories tell you why it is happening.
🖐️ What are the most common touchpoints?
Touchpoints are every instance where a customer interacts with your brand. These can be digital, physical, or human-mediated. Identifying them ensures no channel is overlooked.
- Digital: Website, mobile app, email newsletters, social media posts, paid ads, chatbots.
- Physical: Retail store, packaging, product quality, signage, office location.
- Human: Sales calls, customer support interactions, onboarding specialists, community managers.
Consistency across these touchpoints is vital. If the tone on social media differs from the tone on the phone, it creates cognitive dissonance for the customer.
🛑 How do you identify pain points effectively?
Pain points are the moments of friction where the customer experience breaks down. They are often the most critical area to address for immediate improvement.
- Map the Emotion: Plot the customer’s emotional state at each step. Look for dips in sentiment.
- Review Support Tickets: High volumes of tickets on a specific topic indicate a process failure.
- Watch for Drop-offs: In digital flows, where do users stop? High exit rates signal confusion or friction.
- Ask Directly: “What was the most frustrating part of this process?”
Once identified, pain points should be prioritized based on impact and effort. Addressing a high-impact pain point yields the quickest return on investment.
🔄 How often should you update the journey map?
A journey map is a living document, not a static artifact. The market changes, products evolve, and customer expectations shift. Static maps become obsolete quickly.
- Quarterly Reviews: Check for minor shifts in behavior or feedback.
- Post-Launch: Update immediately after a major product release or feature change.
- Annual Overhaul: Conduct a deep-dive review to ensure the strategy aligns with long-term goals.
- Trigger Events: Update if there is a significant change in the competitive landscape or economic environment.
Regular updates ensure the map remains a relevant tool for decision-making rather than a shelf decoration.
📈 How do you measure the success of a journey map?
The value of a journey map lies in the actions it inspires. Success is measured by the improvement in customer metrics following the implementation of changes derived from the map.
| Success Metric | Definition | Relevance |
|---|---|---|
| Net Promoter Score (NPS) | Customer loyalty and likelihood to recommend | High |
| Customer Satisfaction (CSAT) | Satisfaction with a specific interaction | Medium |
| Customer Effort Score (CES) | How easy it was to complete a task | High |
| Retention Rate | Percentage of customers who continue to buy | High |
| Conversion Rate | Percentage of prospects who become customers | Medium |
Tracking these metrics over time allows you to correlate specific journey improvements with business outcomes.
🚫 What are the most common mistakes to avoid?
Even experienced teams fall into traps when designing maps. Awareness of these pitfalls can prevent wasted effort.
- Internal Bias: Designing the map based on how the company thinks it works, not how the customer experiences it.
- Too Broad: Trying to map every single customer in one document. Focus on specific personas or segments.
- Lack of Data: Guessing the customer’s thoughts without evidence.
- No Action Plan: Creating the map but failing to assign tasks to fix the identified issues.
- Ignoring Emotion: Focusing only on tasks and steps without capturing the emotional journey.
💰 How does journey mapping connect to ROI?
While mapping is often viewed as a marketing exercise, it directly impacts the bottom line. Improved experiences lead to better financial results.
- Increased Lifetime Value: Satisfied customers stay longer and spend more.
- Reduced Acquisition Costs: Happy customers refer others, lowering the cost to gain new business.
- Lower Support Costs: Removing friction reduces the number of support tickets.
- Higher Conversion: A smoother path from consideration to purchase increases sales.
Quantifying these benefits helps justify the resources required to build and maintain the maps.
🏢 Can small businesses utilize this approach?
Absolutely. While large enterprises have vast data, small businesses often have closer relationships with their customers, making qualitative insights easier to gather.
- Start Simple: Use whiteboards or sticky notes instead of complex software.
- Focus on Key Moments: Map only the critical interactions, not every minor touch.
- Leverage Personal Knowledge: Founders often know their customers intimately; document that knowledge.
- Iterate Quickly: Small teams can implement changes faster than large corporations.
The scale of the map does not dictate its value. The clarity of the insight is what matters.
🤝 How do you handle internal resistance?
Change management is often the hardest part of implementation. Departments may resist sharing data or changing established processes.
- Show Evidence: Use customer quotes and data to prove the need for change.
- Involve Stakeholders: Get team members involved in the mapping process early.
- Highlight Wins: Celebrate small improvements resulting from the map.
- Align with Goals: Connect journey improvements to departmental KPIs.
When teams see that the map helps them solve their own problems, resistance turns into collaboration.
🌐 What is the role of omnichannel consistency?
Customers move between channels seamlessly. They might research on mobile, buy on desktop, and return in-store. The journey map must reflect this fluidity.
- Data Integration: Ensure systems talk to each other so the customer does not have to repeat information.
- Brand Voice: Maintain consistent messaging across all platforms.
- Service Continuity: Support agents should have access to the full history of interactions.
Inconsistency breaks trust. A seamless experience across channels reinforces the brand promise.
🖼️ How should you visualize the map?
Visual clarity is essential for communication. The map must be understandable at a glance by anyone in the organization.
- Use Flowcharts: Clearly show the sequence of steps.
- Color Coding: Use colors to indicate emotional states or priority levels.
- Icons: Use symbols to represent different touchpoints (e.g., phone, email, store).
- Whitespace: Avoid clutter to ensure the narrative remains readable.
The visual design should serve the content, not distract from it. Keep it clean and professional.
🚀 What is the next step after mapping?
The map itself is not the end goal; it is a diagnostic tool. The real work begins after the map is completed.
- Prioritize Initiatives: Select the top 3-5 changes to implement first.
- Assign Owners: Ensure every task has a responsible person.
- Set Deadlines: Create a timeline for implementation.
- Monitor Results: Track the metrics defined in the success section.
- Share Widely: Distribute the map to the entire organization for alignment.
Actionable follow-through turns insights into tangible business value. Without execution, the map remains theoretical.
📝 Summary of Key Takeaways
Customer journey mapping is a strategic imperative for any organization seeking to understand and improve the customer experience. It requires cross-functional collaboration, accurate data, and a commitment to continuous improvement. By addressing the questions above, teams can build robust maps that drive meaningful change.
- Focus on the customer: Keep their perspective central to the process.
- Use data: Validate assumptions with real evidence.
- Stay agile: Update maps as the business evolves.
- Act on insights: Turn the map into an action plan.
Implementing these practices builds a culture of empathy and efficiency. It ensures that every decision is made with the customer in mind, leading to sustainable growth and loyalty.

