


In today’s competitive landscape, understanding how a customer interacts with your brand is more than just a nice-to-have. It is a fundamental requirement for sustainable growth. Customer journey mapping provides a structured way to visualize the entire experience your customers have with your business. This process moves beyond simple transaction records to reveal the emotional and functional states of your users at every stage.
Many organizations collect vast amounts of data but struggle to translate it into meaningful action. They see numbers on a dashboard without seeing the story behind the numbers. A robust journey map bridges this gap. It connects raw data points to human behaviors, highlighting where friction occurs and where opportunities for delight exist. This guide walks you through the mechanics of building a map that drives real change.
What Is Customer Journey Mapping? 🤔
At its core, a customer journey map is a visual representation of the process a customer goes through when engaging with a brand. It is not merely a list of touchpoints. It is a narrative tool that captures the customer’s goals, motivations, and feelings throughout their lifecycle.
Think of it as a blueprint for experience. Just as an architect uses a blueprint to ensure a building functions correctly, a business uses a journey map to ensure the customer experience flows logically and efficiently. Without this map, teams often work in silos. Marketing might optimize for acquisition, while support teams focus on retention, potentially creating conflicting experiences.
A comprehensive map aligns these teams. It provides a shared language and a single source of truth regarding the customer’s perspective. It forces stakeholders to look beyond their own departmental metrics and consider the holistic view of the client.
Why Data is the Foundation 📊
Assumptions are the enemy of a useful journey map. Many teams create maps based on internal beliefs rather than external reality. They believe the customer feels X, when in fact the data suggests Y. This disconnect leads to wasted resources on initiatives that do not resonate.
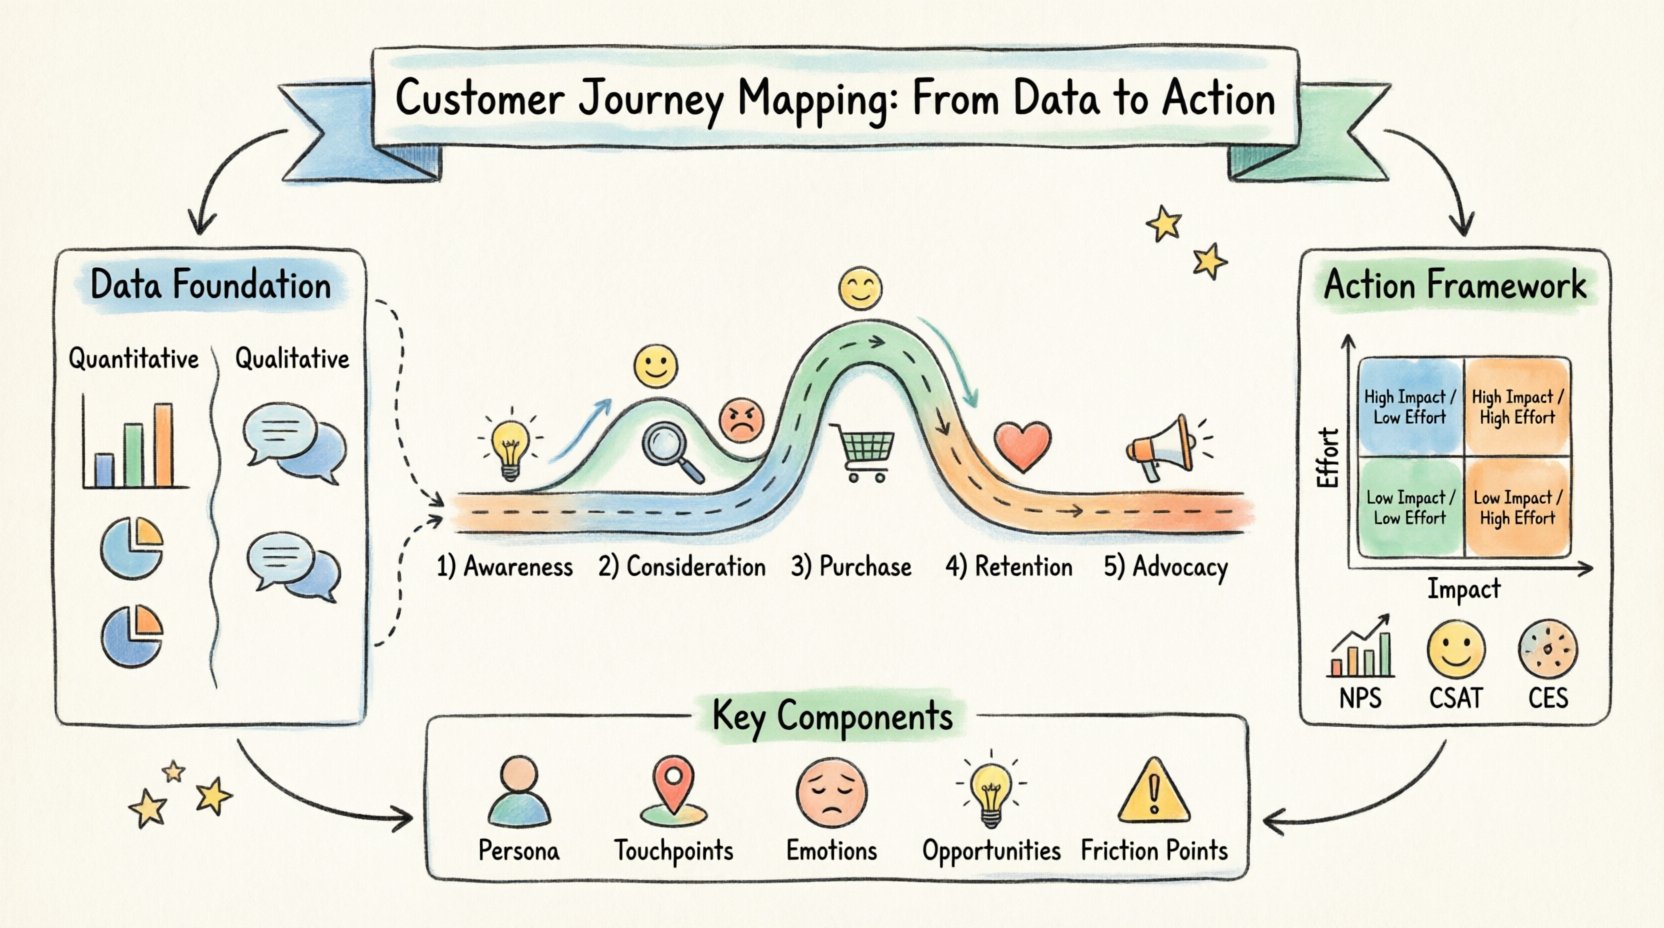
Turning data into actionable insights requires a disciplined approach to information gathering. You must combine quantitative and qualitative data to form a complete picture. Relying on one type of data leaves blind spots.
- Quantitative Data: This includes metrics like page views, conversion rates, time on site, and cart abandonment. It tells you what is happening.
- Qualitative Data: This includes customer interviews, support ticket transcripts, and open-ended survey responses. It tells you why it is happening.
When you layer these datasets, you begin to see patterns. For instance, quantitative data might show a drop-off at a specific checkout step. Qualitative data might reveal that customers find the form confusing or suspicious. Together, they point to a specific fix.
Key Components of a Journey Map 🧩
To build a map that holds up to scrutiny, you need specific components. These elements ensure the map is detailed enough to be useful but broad enough to remain relevant.
1. Personas 👤
Your map is not for everyone; it is for specific segments. A new visitor behaves differently than a loyal subscriber. Define the primary persona you are mapping. This persona should be based on real research, not stereotypes. Include their background, goals, and pain points.
2. Stages of the Journey 🛣️
Divide the journey into logical phases. While every business is different, common stages include:
- Awareness: The customer realizes they have a problem.
- Consideration: They research solutions.
- Purchase: They decide to buy.
- Retention: They use the product or service.
- Advocacy: They recommend the brand to others.
3. Touchpoints 📍
A touchpoint is any interaction a customer has with your brand. This could be an email, a phone call, a website visit, or a social media post. Identify every channel where the customer engages. Ensure you are not missing offline interactions if they are relevant.
4. Emotions and Sentiment 😊😠
Track how the customer feels at each stage. Do they feel excited, frustrated, confused, or reassured? Plotting sentiment over time reveals the emotional highs and lows. A drop in sentiment often indicates a friction point that needs immediate attention.
5. Opportunities 💡
Finally, map out where you can intervene. Identify moments where you can exceed expectations or remove obstacles. These are the actionable insights derived from the map.
Step-by-Step Guide to Building Your Map 🛠️
Creating a journey map is a collaborative exercise. It requires input from multiple departments, including sales, marketing, product, and customer support. Follow this structured approach to ensure accuracy and buy-in.
Step 1: Define the Scope and Goals 🎯
Before drawing lines, clarify what you want to achieve. Are you trying to reduce churn? Increase conversion? Improve onboarding? A map focused on the entire lifecycle is often too broad for a single project. Narrowing the scope allows for deeper analysis. Decide if you are mapping a specific persona or a general experience.
Step 2: Gather Research 📝
Collect data from all available sources. Do not rely on memory or intuition. Review past analytics reports, read customer feedback logs, and conduct interviews. Create a repository of evidence. This step validates the assumptions you might have made previously.
Step 3: Identify Touchpoints and Channels 📱
List every interaction. Be exhaustive. If a customer calls support, that is a touchpoint. If they click an ad, that is a touchpoint. Map these across the timeline of the journey. Consider cross-channel behavior. A customer might research on mobile and purchase on desktop.
Step 4: Map the Emotional State 📉📈
For each touchpoint, note the sentiment. Is the customer happy? Are they waiting in a queue? Are they confused by pricing? Use a scale or descriptive words to capture the emotional temperature. This layer adds the human context to the data.
Step 5: Identify Friction Points ⚠️
Look for gaps between the customer’s goals and their experience. Where do they face resistance? Where does the process slow down? Where is information missing? These friction points are the primary targets for improvement.
Step 6: Validate with Real Users 🔍
Share your draft map with actual customers if possible. Ask them if the journey described matches their reality. They will often point out steps you missed entirely. This validation step ensures the map remains grounded in truth.
Data Types and Corresponding Insights 📊
Not all data is created equal. Understanding the type of data you have helps you determine the type of insight you can extract. Use the table below to categorize your information sources.
| Data Type | Example Source | Potential Insight |
|---|---|---|
| Behavioral | Web Analytics | Users drop off at step 3 of the form. |
| Transactional | Order History | High cart abandonment rate on weekends. |
| Feedback | Surveys | Customers cite slow response times as a frustration. |
| Social | Comments/Reviews | Positive sentiment around a specific feature. |
| Operational | Support Tickets | Recurring questions indicate unclear documentation. |
By cross-referencing these types, you can find correlations. For example, if support tickets spike after a new update (Operational), and satisfaction scores drop (Feedback), the update likely caused the issue.
Turning Observations into Actions 🚀
A map that sits on a shelf is useless. The value comes from the actions taken based on the findings. Once you have identified friction and opportunities, you must prioritize them. Not every issue can be fixed at once.
Prioritization Framework
Use an impact vs. effort matrix to decide what to fix first. Focus on high-impact, low-effort changes to generate quick wins. This builds momentum and demonstrates the value of the mapping process.
- High Impact, Low Effort: Fix these immediately.
- High Impact, High Effort: Plan these as strategic initiatives.
- Low Impact, Low Effort: Do these when resources allow.
- Low Impact, High Effort: Avoid or defer these.
Cross-Functional Execution
Improving the journey often requires changes across teams. Marketing might need to adjust messaging to match reality. Product might need to simplify a workflow. Support might need new training materials. Establish a task force to oversee these changes. Ensure ownership is clear for every action item.
Iterative Improvement
Customer behavior changes. Markets shift. Your map should not be a static document. Schedule regular reviews to update the map with new data. Treat it as a living artifact that evolves with your business.
Common Pitfalls to Avoid ⚠️
Even experienced teams make mistakes when creating journey maps. Being aware of these common errors can save time and prevent frustration.
- Mapping the Ideal, Not the Actual: It is easy to map the perfect scenario. Instead, map the messy reality. Include errors, delays, and confusion.
- Ignoring Internal Barriers: Sometimes the customer’s struggle is caused by internal processes. A slow approval process or outdated inventory system can block the journey.
- Lack of Stakeholder Buy-in: If leadership does not understand the map, they will not support the changes. Educate them on the process and the benefits.
- Overcomplicating the Visuals: Keep the design clean. If the map is too complex, people will not read it. Clarity is key.
- Focusing on One Channel: Customers move between channels. A mobile experience cannot be separated from a desktop experience. Ensure the map covers the full ecosystem.
Measuring Impact and Iterating 📈
How do you know the journey map is working? You need metrics that track experience, not just output. Standard sales figures tell you if a product sold, but not if the customer was happy.
Key Experience Metrics
- Net Promoter Score (NPS): Measures loyalty and likelihood to recommend.
- Customer Satisfaction (CSAT): Measures satisfaction with a specific interaction.
- Customer Effort Score (CES): Measures how easy it is for the customer to complete a task.
- Churn Rate: Measures how many customers leave over time.
- Retention Rate: Measures how many customers stay over time.
Track these metrics before and after implementing changes from the map. A reduction in customer effort score, for example, should correlate with higher retention rates. If the data does not move, revisit the map. Perhaps the root cause was misidentified.
Integration into Operations 🏗️
The final step is embedding the journey mindset into daily operations. This means training employees to think in terms of the customer journey. When a support agent handles a ticket, they should consider the customer’s entire history, not just the current problem.
Leadership should reference the map in strategy meetings. Product roadmaps should be evaluated against how they affect the journey. Marketing campaigns should be designed to support the current stage of the customer.
When the journey becomes the central organizing principle of the business, resources are allocated more effectively. Investment goes to areas that truly move the needle on customer experience. This alignment reduces waste and increases efficiency.
The Long-Term Value of Mapping 🌱
Building a customer journey map is not a one-time project. It is an ongoing discipline. The market changes, new competitors emerge, and customer expectations rise. A living map ensures you stay ahead of these shifts.
By consistently turning data into actionable insights, you create a culture of empathy. You build products and services that solve real problems. You create experiences that customers remember. This is the foundation of a resilient brand.
Start small. Pick one critical journey. Gather the data. Draw the map. Take action. Measure the results. Repeat. Over time, this practice will transform how you understand and serve your customers. The journey is the destination.

