


In the landscape of system architecture, understanding how software interacts with physical resources is critical. A deployment diagram serves as the blueprint for this interaction. It visualizes the physical architecture of a system, showing how software artifacts are mapped to hardware nodes. This document provides a comprehensive guide to constructing these diagrams effectively within the Unified Modeling Language (UML) framework.
📐 Defining the Scope and Purpose
Deployment diagrams belong to the structural diagrams in UML. While class diagrams describe the static structure of the software, deployment diagrams describe the static structure of the infrastructure. They answer questions such as:
- Where does the application run?
- How do components communicate over the network?
- What hardware resources are required for scalability?
- How is data persisted across different storage nodes?
These diagrams bridge the gap between the logical design of an application and the physical environment where it executes. They are essential for DevOps teams, system architects, and infrastructure engineers.
🧩 Core Components of a Deployment Diagram
To create a clear and accurate diagram, one must understand the fundamental building blocks. Every element has a specific role in representing the system’s topology.
1. Nodes
Nodes represent the physical or computational resources. They are depicted as three-dimensional cubes. There are two primary categories:
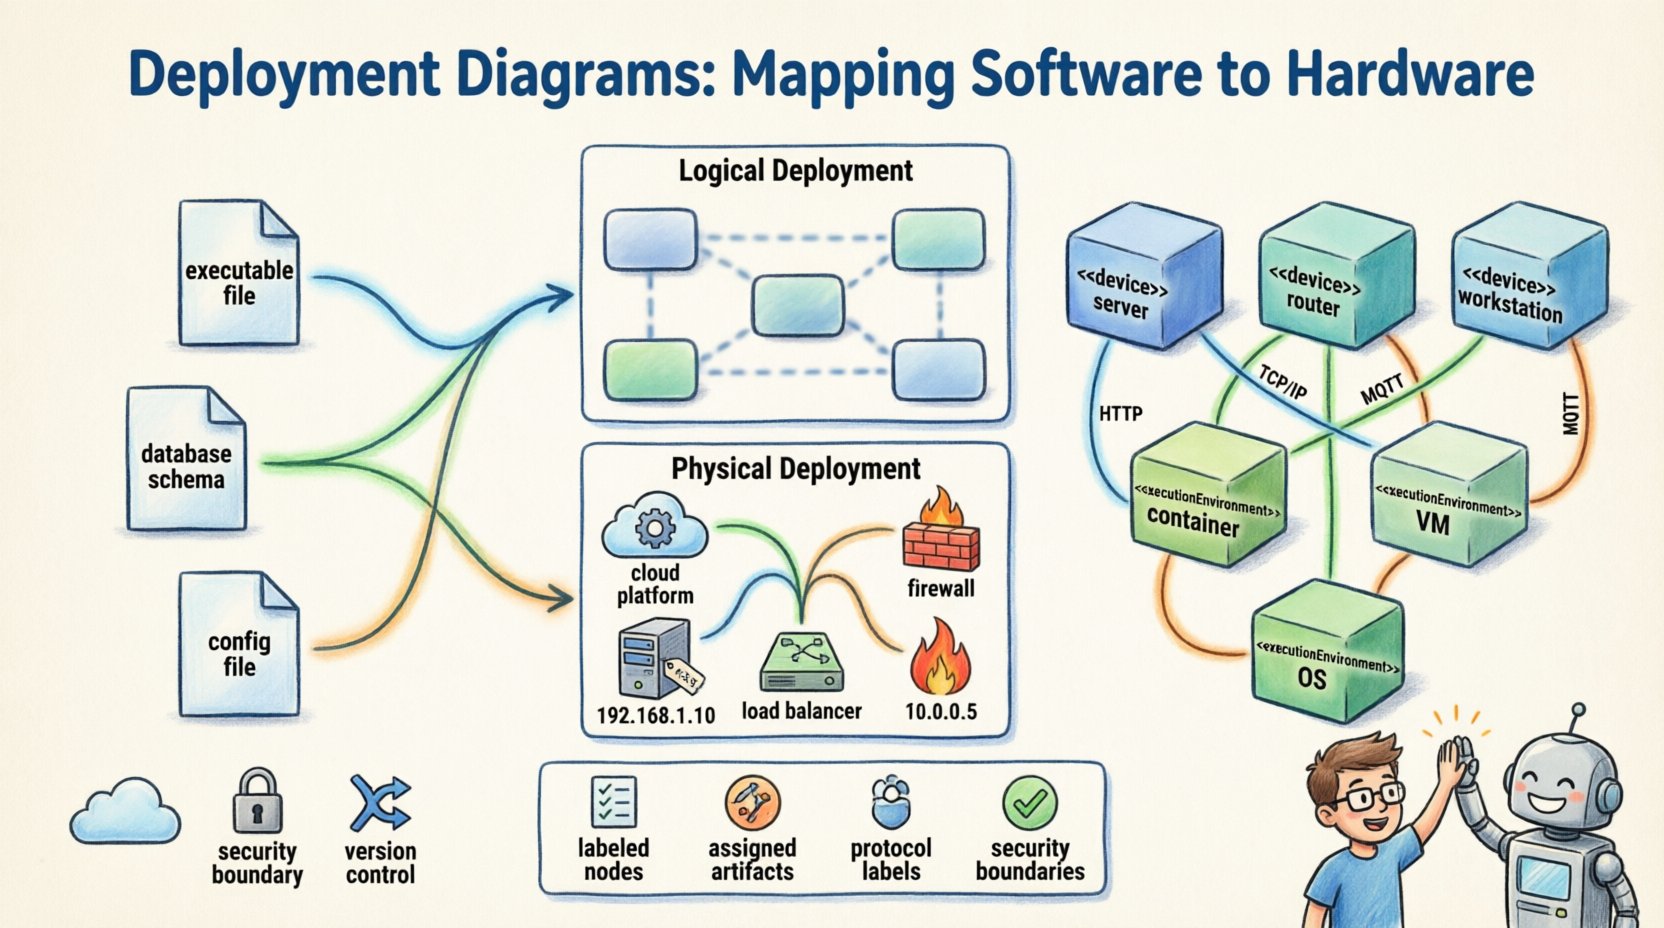
- Device Nodes: Represent physical hardware such as servers, routers, workstations, or mobile devices. These are often labeled with the stereotype <<device>>.
- Execution Environment Nodes: Represent software environments that host artifacts, such as an operating system, a container runtime, or a virtual machine. These carry the stereotype <<executionEnvironment>>.
2. Artifacts
Artifacts are the physical units of software that are deployed to the nodes. Examples include:
- Executable files
- Database schemas
- Configuration files
- Web pages or static assets
- Library dependencies
Artifacts are typically represented as a rectangle with a folded corner. They reside within nodes to show where the code lives.
3. Communication Paths
These are the lines connecting nodes. They represent the network or communication medium. Labels on these lines specify the protocol (e.g., HTTP, TCP/IP, MQTT). This clarifies how data moves between different parts of the infrastructure.
🔗 Relationships and Dependencies
Understanding how elements relate to one another is crucial for mapping the flow of information and control.
| Relationship | Symbol | Description |
|---|---|---|
| Communication | Solid Line | Indicates a network connection between nodes. |
| Dependency | Dashed Line (Open Arrow) | Indicates that one node relies on another for functionality. |
| Association | Solid Line | Indicates a direct link or connection without dependency direction. |
| Generalization | Solid Line (Closed Triangle) | Indicates inheritance or specialization of node types. |
When drawing these relationships, ensure that the directionality is clear. For instance, a client node depends on a server node. The arrow should point from the client to the server to denote the direction of the request.
📊 Levels of Abstraction
Not all deployment diagrams need to show every detail. Depending on the audience, diagrams should be created at different levels of abstraction.
Logical Deployment
Logical diagrams focus on the functional components without getting bogged down in specific hardware details. They show:
- High-level services
- Major software modules
- General network topology
This level is useful for stakeholders who need to understand the system flow without technical infrastructure constraints.
Physical Deployment
Physical diagrams show the exact hardware and network configuration. They include:
- Specific server models
- IP addresses and subnets
- Load balancers and firewalls
- Storage configurations
Engineers use this level for implementation, testing, and maintenance planning.
🛠️ Construction Guidelines
Creating an effective deployment diagram requires a structured approach. Follow these steps to ensure accuracy and consistency.
- Analyze the Architecture: Review the system requirements and component diagrams to identify what needs to be deployed.
- Identify Nodes: List all hardware and software environments required. Group them by function (e.g., Frontend, Backend, Database).
- Map Artifacts: Assign specific software units to the nodes where they will run.
- Define Connections: Draw the communication paths between nodes. Label protocols clearly.
- Review for Redundancy: Check for duplicate nodes or unnecessary connections that clutter the diagram.
- Validate Consistency: Ensure the diagram matches the current state of the system.
📝 Best Practices for Clarity
To maintain readability, adhere to these standards.
- Consistent Naming: Use clear, descriptive names for nodes and artifacts. Avoid abbreviations that are not industry-standard.
- Grouping: Use composite nodes to group related artifacts. This reduces visual noise.
- Color Usage: If the tool allows, use color to distinguish between environments (e.g., production vs. development), but keep it minimal.
- Separation of Concerns: Do not mix logical and physical details in a single diagram unless necessary.
- Documentation: Add notes to explain complex routing or security requirements.
❌ Common Pitfalls to Avoid
Even experienced architects can make mistakes. Watch out for these common issues.
- Over-complication: Including too many details can make the diagram unreadable. Focus on the critical infrastructure.
- Missing Labels: Unlabeled connections lead to ambiguity about data flow.
- Inconsistent Notation: Mixing different symbols for the same element type confuses readers.
- Ignoring Security: Failing to show firewalls or security gateways can lead to security gaps in the design.
- Static Representation: Assuming the infrastructure never changes. Deployment diagrams should be versioned and updated.
🔄 Integration with Other UML Diagrams
A deployment diagram does not exist in isolation. It complements other diagrams in the UML suite.
- Class Diagrams: Show the internal structure of the software. Deployment diagrams show where that software lives.
- Sequence Diagrams: Show the interaction over time. Deployment diagrams show the physical endpoints of these interactions.
- Use Case Diagrams: Show user interactions. Deployment diagrams show the system boundary where these interactions are processed.
When updating a class diagram, check if the deployment requirements have changed. If a new microservice is added, the deployment diagram must be updated to reflect the new node.
🔒 Security Considerations
Security is a primary concern in infrastructure mapping. Deployment diagrams help visualize security boundaries.
- Network Segmentation: Show how the internal network is separated from the public internet.
- Access Control: Indicate which nodes require authentication before communication.
- Data Protection: Highlight where encryption occurs, such as at the database level or during transit.
By visualizing these boundaries, architects can identify potential vulnerabilities before implementation begins.
📈 Maintenance and Evolution
Infrastructure is dynamic. As systems scale, the diagram must evolve.
- Version Control: Treat the diagram as code. Store it in a repository to track changes over time.
- Automated Updates: Where possible, generate diagrams from infrastructure code to ensure accuracy.
- Periodic Review: Schedule reviews to ensure the diagram matches the deployed environment.
Failure to update the diagram leads to technical debt. Teams may rely on outdated information, causing deployment errors or security incidents.
🌐 Cloud and Distributed Systems
Modern systems often rely on distributed architectures. Deployment diagrams adapt to these environments.
- Virtual Machines: Represented as nodes hosting multiple instances of software.
- Containers: Often grouped under a specific runtime node.
- Serverless Functions: May be represented as artifacts deployed to a cloud platform node.
Even in cloud environments, the principles of mapping artifacts to execution environments remain the same. The key is to abstract the underlying hardware while maintaining the logical structure.
📋 Summary of Key Elements
Before finalizing a deployment diagram, review the checklist below.
- Are all nodes clearly labeled?
- Are all artifacts assigned to a node?
- Are communication paths labeled with protocols?
- Is the level of abstraction appropriate for the audience?
- Are security boundaries visible?
- Is the diagram consistent with other architectural documents?
Adhering to these standards ensures that the diagram serves its purpose: to provide a clear, actionable map of the system’s physical reality.
🚀 Final Thoughts
Deployment diagrams are more than just drawings; they are communication tools. They align the technical team with the business stakeholders regarding infrastructure requirements. By following UML standards and maintaining a focus on clarity, these diagrams become invaluable assets throughout the software development lifecycle. They reduce ambiguity, prevent deployment errors, and facilitate better planning for system growth.
Invest time in creating accurate diagrams. The effort pays off during troubleshooting, scaling, and onboarding new team members. A well-documented infrastructure map is the foundation of a reliable system.

