


Understanding system architecture is critical for successful software delivery. A deployment diagram provides a static view of the physical hardware and software environment. It maps out the nodes, artifacts, and communication paths that define how a system is realized in the real world. This guide addresses the most common inquiries regarding these diagrams to clarify their purpose, structure, and application.
What is the Primary Purpose of a Deployment Diagram? 🎯
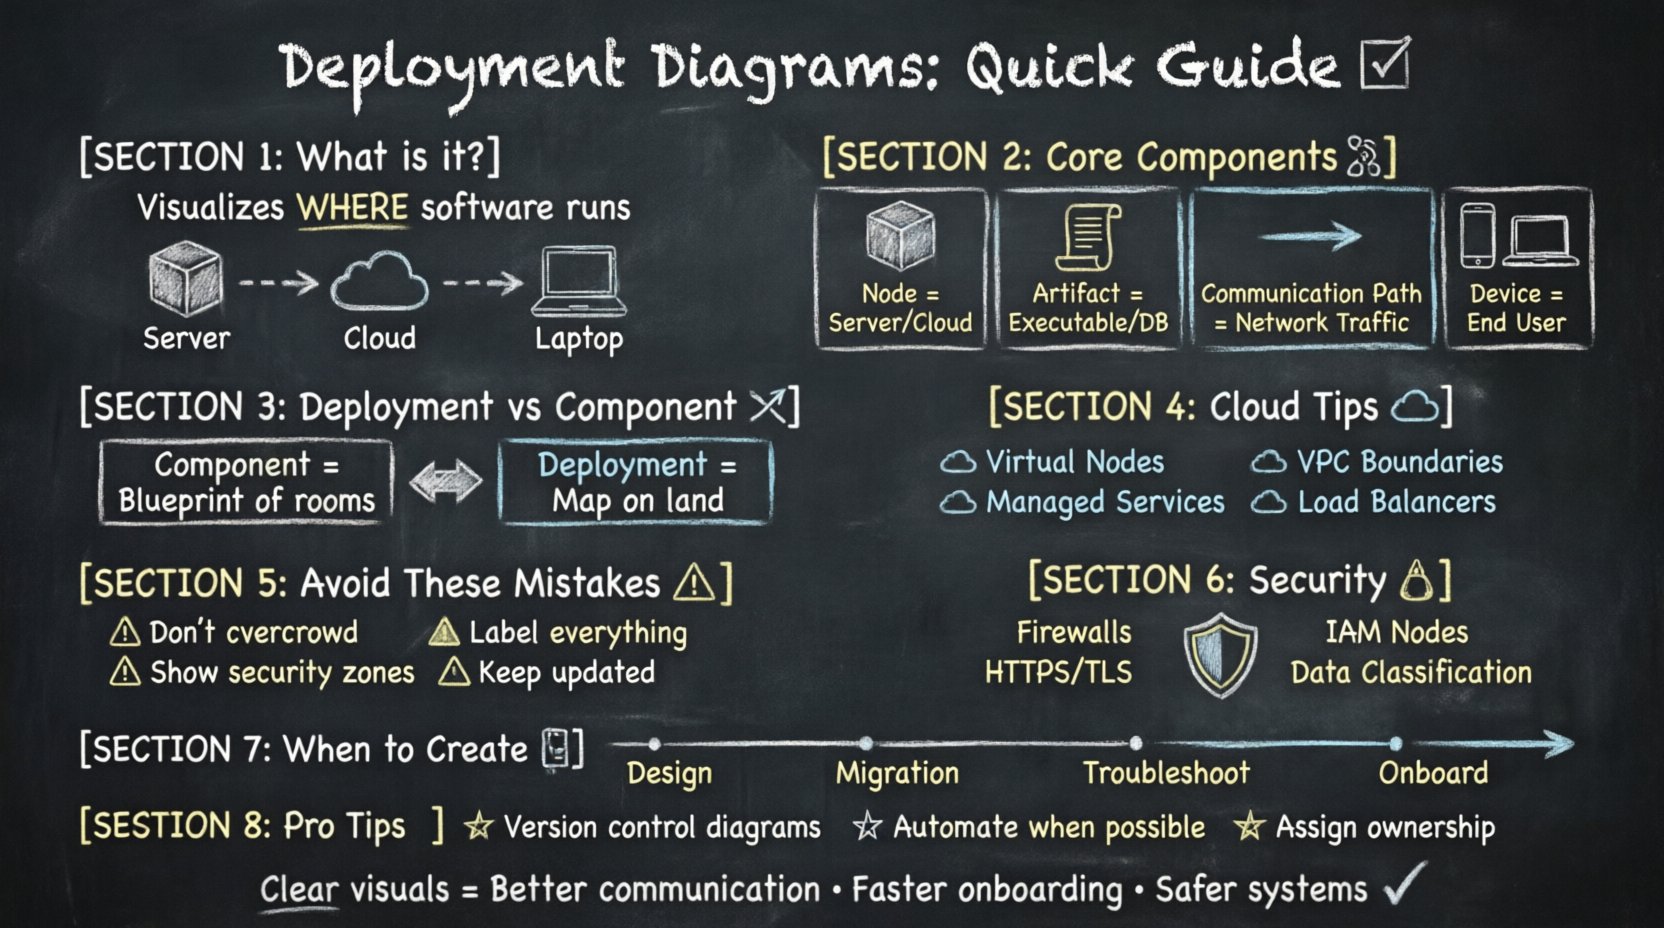
The fundamental role of a deployment diagram is to visualize the physical architecture of a system. Unlike design diagrams that focus on logic or code structure, this diagram focuses on the infrastructure. It answers the question: “Where does the software run?”
- Infrastructure Mapping: It shows servers, devices, and network nodes.
- Component Placement: It indicates which software artifacts are installed on which hardware.
- Communication Analysis: It defines how different parts of the system talk to each other across the network.
- Resource Planning: It helps teams estimate hardware requirements and network bandwidth needs.
By providing a clear map of the physical topology, stakeholders can identify bottlenecks, security risks, and scaling opportunities before implementation begins.
What Are the Core Components of a Deployment Diagram? 🧩
These diagrams rely on specific symbols to represent distinct elements of the architecture. Understanding these symbols is essential for creating an accurate model.
| Component | Visual Representation | Definition |
|---|---|---|
| Node | 3D Cube or Rectangle | A physical computation resource, such as a server, workstation, or cloud instance. |
| Artifact | Document Icon | A physical piece of information, such as a database schema, executable file, or library. |
| Communication Path | Line with Arrow | The connection between nodes, representing network traffic or data flow. |
| Device | Mobile Phone Icon | End-user hardware, such as laptops, tablets, or IoT sensors. |
Each component serves a specific function in defining the runtime environment. Combining them correctly ensures the diagram accurately reflects the target infrastructure.
How Does a Deployment Diagram Differ from a Component Diagram? 🆚
It is common to confuse deployment diagrams with component diagrams, as both deal with software parts. However, their focus differs significantly.
- Component Diagram: Focuses on the logical organization of software. It shows classes, modules, and libraries without regard to where they run.
- Deployment Diagram: Focuses on the physical realization. It shows the hardware and the specific deployment of those components onto that hardware.
Think of the component diagram as the blueprint of the house’s rooms, while the deployment diagram is the map showing where the house sits on the land.
How Do You Represent Cloud Environments? ☁️
Modern systems often reside in cloud environments rather than on-premise servers. Representing this requires specific considerations.
- Virtual Nodes: Use nodes to represent virtual machines or container clusters within a cloud provider.
- Services: Represent managed services (like databases or message queues) as artifacts hosted on cloud nodes.
- Network Segments: Use boundaries to show virtual private clouds (VPCs) or subnets to indicate isolation.
- Load Balancers: Explicitly draw load balancer nodes to show how traffic is distributed across multiple instances.
Accurately modeling cloud infrastructure helps teams understand scaling policies and availability zones.
What Are the Common Mistakes When Creating These Diagrams? ⚠️
Creating these diagrams is straightforward, but errors can lead to confusion during implementation.
- Overcrowding: Trying to show every single microservice in a single view makes the diagram unreadable. Break complex systems into layers or views.
- Missing Labels: Failing to label nodes or connections forces readers to guess the purpose of a component.
- Ignoring Security Zones: Not distinguishing between public-facing servers and internal databases creates security blind spots.
- Stale Information: Updating the code without updating the diagram renders it useless for future reference.
How Should You Handle Security and Access Control? 🔒
Security is a primary concern in system architecture. Deployment diagrams can explicitly show security boundaries.
- Firewalls: Use distinct shapes or boundaries to represent firewalls and gateways between network segments.
- Encryption: Label communication paths with protocols like HTTPS or TLS to indicate encrypted traffic.
- Authentication Nodes: Include specific nodes for Identity and Access Management (IAM) services.
- Data Classification: Use artifacts to show where sensitive data is stored and ensure it is not placed on public-facing nodes.
Visualizing security controls early in the design phase reduces the risk of vulnerabilities in the production environment.
When Is the Best Time to Create a Deployment Diagram? 📅
Timing matters for the effectiveness of the documentation.
- During Design: Create the initial diagram to plan the infrastructure before writing code.
- During Migration: Update the diagram when moving from on-premise to cloud or between cloud providers.
- During Troubleshooting: Use the diagram to trace data flow when diagnosing network latency or connection issues.
- During Onboarding: Use it to train new developers on the system’s physical layout.
How Do You Manage Diagram Updates? 🔄
Systems evolve, and diagrams must evolve with them. Keeping them current requires discipline.
- Version Control: Store diagram files in the same repository as the code to track changes alongside the application.
- Review Cycles: Include diagram reviews in the standard change approval process.
- Automation: Where possible, generate diagrams from infrastructure code to reduce manual maintenance.
- Ownership: Assign a specific architect or DevOps engineer to maintain the integrity of the diagrams.
Can Deployment Diagrams Help with Scaling? 📈
Yes, they are essential for capacity planning.
- Identify Bottlenecks: Show where traffic concentrates and plan for additional nodes in those areas.
- Replication Strategy: Indicate how data is replicated across nodes to ensure availability.
- Redundancy: Show backup nodes to ensure the system survives hardware failures.
- Cost Estimation: Count the number of nodes to estimate infrastructure costs more accurately.
What Is the Relationship Between Deployment and CI/CD? 🔄
Continuous Integration and Continuous Deployment (CI/CD) pipelines rely on deployment targets.
- Pipeline Configuration: The deployment diagram defines the target environments (Dev, Test, Prod) for the pipeline.
- Artifact Promotion: It shows how artifacts move from development nodes to production nodes.
- Environment Parity: Ensures that the testing environment matches the production environment as closely as possible.
How Do You Represent Databases? 🗃️
Databases are critical artifacts that require clear representation.
- Separate Nodes: Place database servers on dedicated nodes to highlight their resource intensity.
- Connection Types: Distinguish between read-only replicas and primary write nodes.
- Storage Volume: Indicate the type of storage (SSD, HDD) if it impacts performance significantly.
- Backup Strategy: Show separate backup storage nodes to visualize data recovery paths.
What Are the Standards for Drawing These Diagrams? 📐
While there are no mandatory software standards, adhering to modeling conventions ensures clarity.
- Consistency: Use the same shapes for the same types of nodes throughout the document.
- Legend: Include a legend if custom shapes are used for specific hardware.
- Layout: Arrange nodes logically, such as placing client devices at the top and backend servers at the bottom.
- Clarity: Avoid crossing lines where possible to maintain readability.
How Do You Handle Legacy Systems? 🏛️
Integrating older technology requires careful documentation.
- Integration Points: Clearly mark where legacy systems connect to modern microservices.
- Middleware: Show any middleware used to bridge communication between old and new systems.
- Decommission Plan: Indicate if legacy nodes are scheduled for removal in future diagrams.
What Tools Are Typically Used for Creation? 🛠️
While specific software names are not the focus, the types of tools used vary.
- Diagramming Software: Dedicated visual modeling tools allow for drag-and-drop component placement.
- Text-Based Tools: Some teams prefer defining diagrams using code to ensure version control compatibility.
- Documentation Platforms: Integrated wikis often support diagram rendering directly within pages.
Why Is Visual Clarity Important? 👁️
A complex system is hard to manage without a clear visual guide.
- Communication: It bridges the gap between developers, operations, and business stakeholders.
- Onboarding: New team members can understand the architecture in hours rather than weeks.
- Audit: Auditors can quickly verify that security controls are in place based on the visual layout.
- Disaster Recovery: In an outage, the diagram provides a quick reference for where services are hosted.
Can One Diagram Cover the Whole System? 🌐
For large systems, a single diagram is often insufficient.
- Layering: Use high-level diagrams for the overview and detailed diagrams for specific subsystems.
- Zoom Levels: Create a summary view and drill-down views for critical areas.
- Modularity: Split diagrams by business domain or functional area.
Structuring the documentation this way prevents information overload and keeps the focus on the relevant details.
How Do You Ensure Accuracy? ✅
Accuracy is the value of the diagram.
- Validation: Review the diagram with the operations team to confirm it matches the actual environment.
- Testing: Verify that the connections shown in the diagram actually function in the test environment.
- Feedback Loop: Encourage team members to report discrepancies immediately.
Regular validation ensures the diagram remains a trusted source of truth for the project.

