
Strategic planning often feels like navigating a foggy landscape. You have a map, but the terrain changes faster than the ink dries. This is where the PEST Analysis becomes indispensable, yet frequently misunderstood. Too often, teams treat it as a static checklist—a bureaucratic exercise to be completed once a year and filed away. However, when executed with depth and intent, PEST Analysis reveals the shifting tides of the external environment long before they become obvious to the rest of the market.
To find the gold, you must move beyond surface-level observations. You need to understand how Political, Economic, Social, and Technological factors interact. This guide details how to extract meaningful intelligence from your environmental scan, transforming raw data into a competitive advantage.
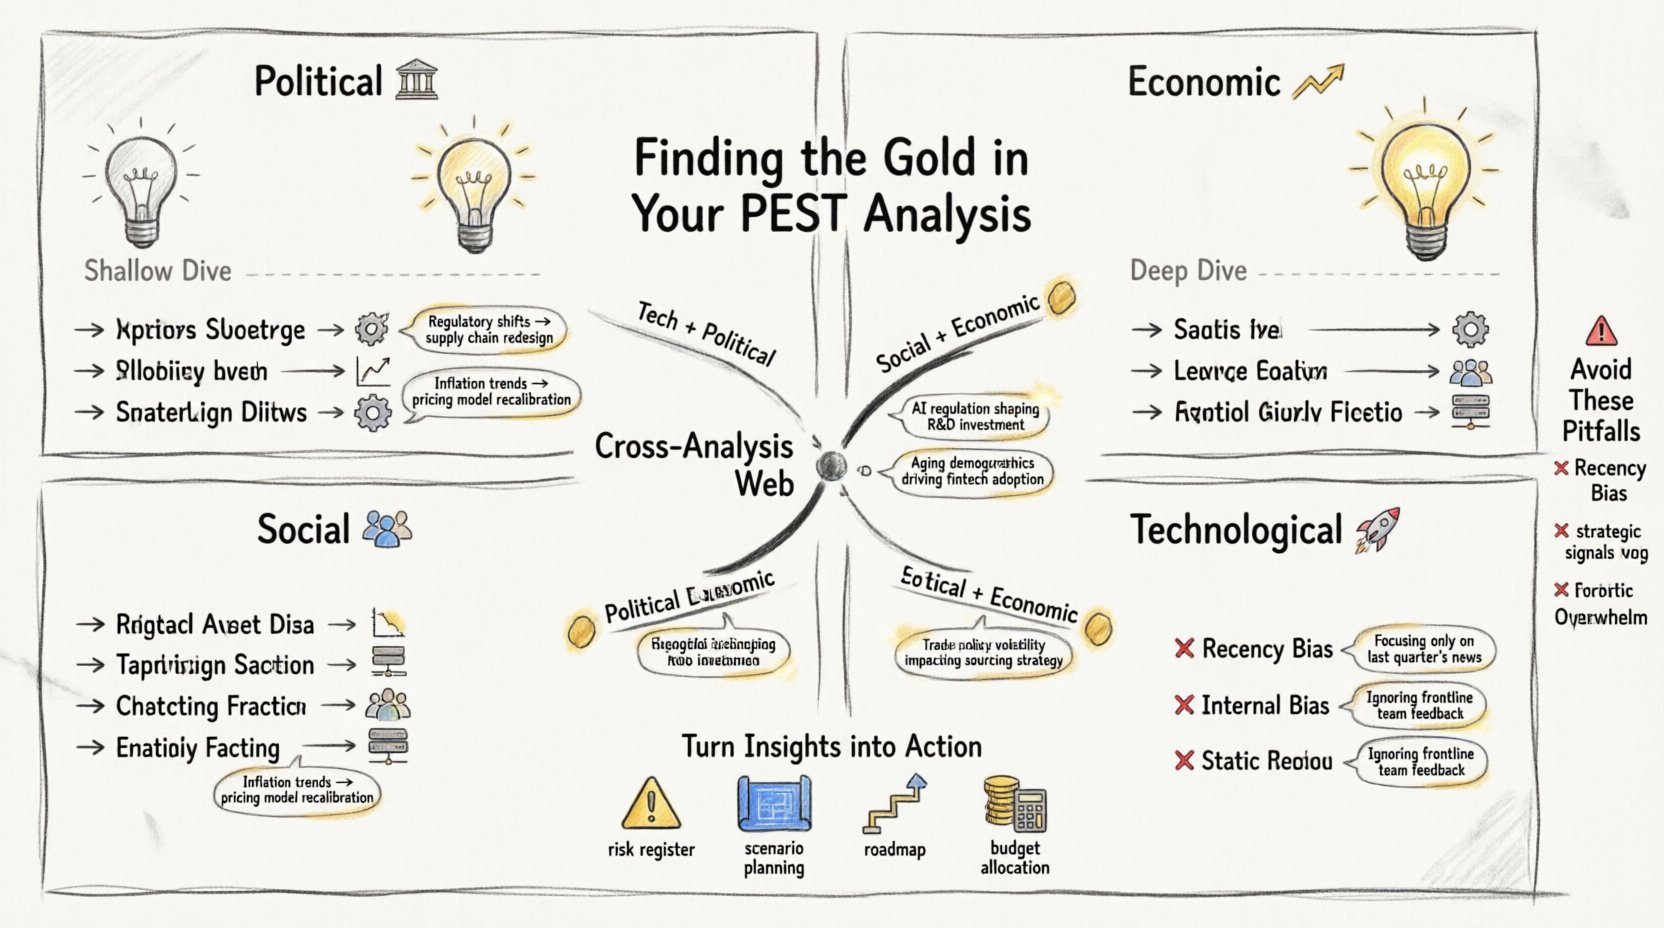
🔍 Understanding the PEST Framework: More Than a Checklist
The PEST framework stands for Political, Economic, Social, and Technological. It is a tool for scanning the macro-environment. Most organizations stop at defining the factors. They list regulations, note inflation rates, acknowledge demographic shifts, and mention new software trends. This is not enough. The value lies in the connections between these factors and their specific impact on your business model.
Consider the difference between a shallow scan and a deep dive:
- Shallow Scan: “There is new tax legislation.” “Inflation is high.” “People are using smartphones more.” “AI is emerging.”
- Deep Dive: “New tax legislation affects our supply chain margins in Region X.” “Inflation is driving consumer behavior toward premium goods.” “Smartphone adoption allows us to pivot to mobile-first support.” “AI automation threatens our current staffing model.”
The goal is to identify signals, not just noise. A signal is a change that has the potential to alter your strategic trajectory. Noise is simply background data. Your team must learn to distinguish the two.
🏛️ Political Factors: Beyond the Headlines
Political factors encompass the influence of government on the economy. This is often the most visible quadrant, but also the most prone to misinterpretation. It is easy to look at the laws and assume they apply uniformly. In reality, policy implementation varies by region and industry.
When analyzing Political factors, look for the following hidden layers:
- Trade Policies and Tariffs: It is not just about import duties. Consider how trade wars might force supply chain restructuring. If tariffs rise on raw materials, does your cost base shift enough to alter pricing strategy?
- Regulatory Stability: Is the political climate stable or volatile? High volatility increases the cost of capital and slows investment decisions.
- Corporate Social Responsibility Mandates: Governments are increasingly demanding sustainability reporting. This is not just compliance; it is a new market filter.
- Subsidies and Grants: Where is the government directing funding? If they are subsidizing green energy, your competitors might pivot to capture that support.
Ask yourself: If the administration changes in two years, what happens to our current roadmap? This scenario planning is where the real insight hides.
📈 Economic Indicators: Reading the Subtext
Economic factors determine the purchasing power of your customers and the cost of capital for your business. Standard reports list GDP, interest rates, and unemployment. These are lagging indicators. To find the gold, you need leading indicators.
Deep analysis in this quadrant involves:
- Currency Fluctuations: If you import materials, exchange rates directly impact margins. Hedge strategies are essential, but so is pricing elasticity modeling.
- Disposable Income Trends: GDP growth might be positive, but is income distributed evenly? If the middle class shrinks while the wealthy grow, your product positioning must shift.
- Cost of Labor: Beyond unemployment rates, look at wage inflation in your specific sector. If labor costs rise faster than productivity, you must automate or restructure.
- Consumer Confidence: This predicts spending behavior before actual sales data appears. Monitor sentiment indices closely.
Table 1: Economic Factors Analysis
| Factor | Standard View | Strategic Insight |
|---|---|---|
| Inflation | Prices are rising. | Can we pass costs to customers without losing volume? |
| Interest Rates | Borrowing is expensive. | Should we prioritize debt reduction or lock in long-term financing? |
| Employment | Jobs are available. | Is talent scarce in our niche? What does this mean for retention? |
👥 Social Shifts: The Human Element
Social factors relate to the demographic and cultural aspects of your external environment. This is often the most intuitive quadrant, which leads to complacency. Everyone knows that populations age or that technology changes habits. The insight comes from the rate of change and the implication for your specific offering.
Key areas to scrutinize:
- Demographic Aging: If your target market is aging, your product lifecycle needs adjustment. Features that appeal to youth may need to be simplified or modified for older users.
- Lifestyle Changes: Remote work has permanently altered office real estate demand and communication tools. Is your business built on the assumption of physical presence?
- Cultural Values: How do consumer values shift regarding privacy, sustainability, or health? A company ignoring the demand for transparency risks reputational damage.
- Urbanization: As people move to cities, logistics and distribution channels must adapt. Last-mile delivery becomes critical.
Do not rely on census data from five years ago. Look at social media trends, search volume data, and local community shifts. These provide real-time feedback on social sentiment.
🚀 Technological Trends: The Disruptive Force
Technological factors cover innovation, automation, and research and development activity. This is the quadrant where hype is highest, making it the hardest to filter. You must separate the buzz from the breakthrough.
Effective analysis requires:
- Infrastructure Development: Is 5G rolling out in your target markets? Is fiber optics access improving? These underpin digital capabilities.
- Automation Capabilities: Look at the cost of robotics or software automation. If the cost of labor exceeds the cost of automation, the competitive landscape shifts instantly.
- Data Privacy Laws: Technology allows data collection, but regulation limits it. How does this affect your marketing and product development?
- Patent Activity: Monitor what competitors are patenting. This indicates where they are investing R&D resources.
Question your own technology stack. Are you reliant on legacy systems that cannot integrate with emerging standards? Technical debt is a strategic liability.
🔗 Synthesizing the Data: The Cross-Analysis
The true power of PEST Analysis emerges when you combine the quadrants. A factor in one area often triggers a reaction in another. This cross-analysis reveals the complex web of risk and opportunity.
For example:
- Technology + Political: A new data sovereignty law (Political) might force you to invest in local servers (Technology), increasing costs (Economic).
- Social + Economic: An aging population (Social) creates a labor shortage (Economic), driving up wages and forcing automation (Technology).
- Political + Economic: A trade war (Political) leads to tariffs (Economic), which raises prices for consumers (Social), potentially reducing demand.
Table 2: Cross-Sector Interaction Matrix
| Combination | Scenario | Strategic Response |
|---|---|---|
| Political + Social | Health regulations change due to public pressure. | Adjust product safety features; update compliance protocols. |
| Economic + Tech | High interest rates slow software adoption. | Offer leasing models instead of sales; highlight ROI. |
| Social + Tech | Privacy concerns rise due to data breaches. | Invest in encryption; market transparency as a feature. |
This synthesis moves you from observation to prediction. You are no longer reacting to news; you are anticipating outcomes based on systemic relationships.
🛠️ Turning Insights into Strategic Action
Information without action is merely trivia. Once you have identified the hidden insights, you must integrate them into your operational planning. Here is how to operationalize the findings:
- Update Risk Registers: Add the identified external risks to your official risk management documentation. Assign owners and mitigation strategies.
- Scenario Planning: Develop “What If” scenarios based on your PEST findings. If inflation hits 5%, what happens? If a new regulation passes, what is the contingency?
- Product Roadmap Adjustment: If Social trends show a shift in consumer values, prioritize features that align with those values in the next quarter.
- Resource Allocation: If Economic factors suggest a downturn, shift budget from growth initiatives to efficiency and cash preservation.
⚠️ Common Pitfalls to Avoid
Even with a robust framework, teams make mistakes that dilute the value of the analysis. Be vigilant against these errors:
- Recency Bias: Focusing only on the last 12 months. PEST trends often take years to materialize. Look at 5 to 10-year projections.
- Internal Bias: Fitting external data to fit internal preconceptions. If you believe your strategy is perfect, the data will look supportive. Challenge your assumptions.
- Static Reporting: Treating the analysis as a one-time event. The environment is dynamic. Review the PEST factors quarterly.
- Overwhelm: Gathering too much data. Focus on the top three factors in each quadrant that directly impact your core business model.
📋 Key Questions for Each Sector
To ensure you are digging deep, use this questionnaire during your workshops. If you cannot answer these, you need more research.
- Political: Are there upcoming elections that could change our regulatory environment? How does our political stance affect our brand reputation?
- Economic: How does our pricing model hold up during a recession? What is our exposure to foreign currency exchange?
- Social: How does our product fit into the daily lives of our customers? What cultural taboos should we avoid in our marketing?
- Technological: What technology could render our product obsolete? Are we investing enough in R&D to stay ahead of the curve?
🌐 Final Thoughts on Strategic Foresight
The market does not wait for anyone to finish a report. Competitors are scanning the horizon right now. By adopting a rigorous, deep-dive approach to PEST Analysis, you gain a clearer view of the path ahead. This is not about predicting the future with certainty; it is about preparing for multiple futures.
When you move beyond the checklist mentality, you transform your planning process. You stop guessing and start knowing. You identify the hidden risks before they become crises and spot the opportunities before they become crowded markets. This is the essence of strategic foresight. It requires discipline, continuous learning, and the courage to act on uncomfortable truths. With this foundation, your organization is better positioned to navigate the complexities of the modern business landscape.

