


Understanding system interactions requires a clear visual language. In the world of Unified Modeling Language (UML), sequence diagrams serve as a critical tool for mapping out how objects or components communicate over time. This guide provides a deep dive into reading sequence diagrams, focusing on messages, lifelines, and control flow. By mastering these elements, technical teams can design robust systems and document complex logic effectively.
🔍 What Is a Sequence Diagram?
A sequence diagram is an interaction diagram that shows how processes operate with one another and in what order. The primary purpose is to visualize the flow of data and control between system parts. Unlike class diagrams which focus on structure, sequence diagrams focus on behavior and timing.
When analyzing a sequence diagram, you are essentially reading a script for a software execution. It lays out:
- The participants involved in the interaction.
- The messages passed between them.
- The order in which these messages occur.
- The state of participants during the interaction.
This visualization helps developers identify bottlenecks, logical errors, and unclear dependencies before writing code. It serves as a contract between different parts of a system.
🏗️ The Core Components: Lifelines and Participants
The foundation of any sequence diagram rests on its vertical lines. These represent the entities participating in the interaction. Understanding lifelines is the first step to accurate interpretation.
1. Lifelines
A lifeline represents a participant in the interaction. It is a vertical dashed line that extends from the top of the diagram to the bottom. This line signifies the existence of the object or actor throughout the duration of the sequence. Think of it as a timeline for that specific entity.
- Top Edge: Represents the creation or arrival of the participant.
- Bottom Edge: Represents the destruction or end of the participant.
- Label: Usually placed at the top of the line to identify the object, such as
UserInterface,Database, orPaymentGateway.
2. Actors and Objects
Participants can be human actors or software components. Actors are typically depicted with a stick figure icon, while objects are represented by a rectangle with the object name underlined.
Common participants include:
- Boundary Objects: Interfaces or screens that interact with users.
- Control Objects: Logic handlers that coordinate actions.
- Entity Objects: Data storage or business logic repositories.
- External Systems: Third-party APIs or services.
✉️ Understanding Messages and Communication
Messages are the horizontal arrows connecting lifelines. They indicate that a signal is being sent from one participant to another. Reading the direction and style of these arrows is crucial for understanding the flow of control.
1. Direction and Types
Arrows point from the sender to the receiver. The style of the arrow indicates the nature of the message.
| Arrow Style | Type | Behavior |
|---|---|---|
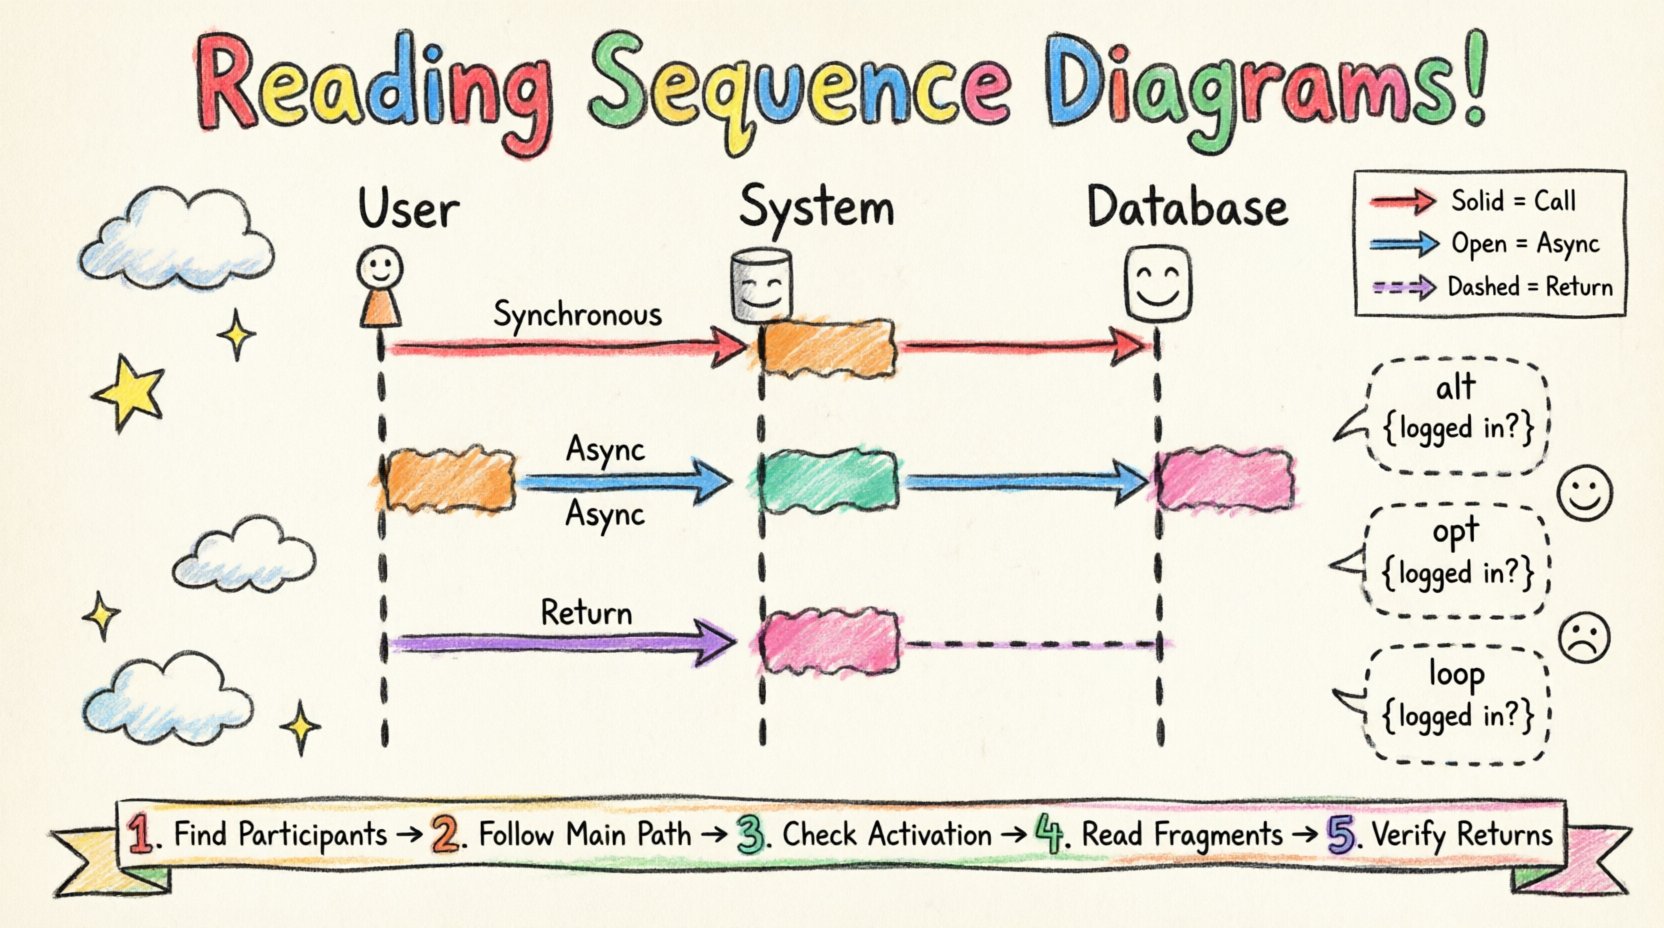
| Solid Line with Filled Arrowhead | Synchronous Call | The sender waits for the receiver to finish processing before continuing. |
| Solid Line with Open Arrowhead | Asynchronous Message | The sender sends the message and continues without waiting. |
| Dashed Line with Open Arrowhead | Return Message | The receiver sends a response back to the sender. |
| Line with Circle at Start | Create Message | Signals the instantiation of a new object. |
| Line with ‘X’ at End | Destroy Message | Signals the termination of an object. |
2. Message Details
Each message should ideally include a label describing the action. This might be a method call, a query, or an event. For example, login(username, password) or fetchData().
When reading a diagram, trace the messages from top to bottom. This represents the chronological order of execution. If multiple messages originate from the same lifeline, they are processed in sequence.
⏱️ Activation Bars and Control Flow
Activation bars, also known as execution occurrences, are thin rectangles placed on a lifeline. They indicate the period during which an object is performing an action or is actively executing.
1. Interpreting Activation
- Start Point: The top of the rectangle marks when the object receives a message or starts an action.
- End Point: The bottom marks when the action is complete or a return message is sent.
- Duration: The length of the bar represents the time spent executing, relative to other bars.
Activation bars help visualize concurrency. If two activation bars overlap on different lifelines, it means those operations are happening simultaneously. This is vital for understanding performance and locking mechanisms.
2. Control Flow Logic
Control flow describes the decision-making path within the diagram. It is not just about who calls whom, but the logic governing the sequence.
- Conditionals: Some paths only exist if specific conditions are met.
- Loops: Certain actions repeat until a condition changes.
- Exceptions: Error handling paths that deviate from the standard flow.
Reading control flow requires looking beyond the main line. You must check the combined fragments (discussed below) to see alternative paths.
🧩 Handling Logic with Combined Fragments
Real-world systems rarely follow a single straight path. Sequence diagrams use frames to encapsulate complex logic. These are called Combined Fragments. They allow you to show alternative, optional, or repeated behaviors within the diagram.
1. Common Fragment Types
| Operator | Meaning | Use Case |
|---|---|---|
| alt (Alternative) | Chooses one block based on a condition. | If user is logged in, show dashboard; else, show login. |
| opt (Optional) | Shows behavior that may or may not occur. | Send email notification (only if configured). |
| loop | Repeats the enclosed interaction. | Process a list of items one by one. |
| break | Terminates the current flow early. | Abort transaction if payment fails. |
| par (Parallel) | Multiple interactions happen simultaneously. | Update cache and log activity at the same time. |
| region | Identifies a specific region of the diagram. | Group related actions under a named context. |
2. Reading Fragment Frames
Fragments are enclosed in a dashed rectangle with a label in the top-left corner. The label defines the operator (e.g., [alt]). Conditions are often placed in curly braces {} within the frame.
When reading an alt block, scan the conditions carefully. Only one block executes. If no condition is specified, it is assumed to be the default path. In loop blocks, the condition inside the curly braces determines when the repetition stops.
📖 Reading Sequence Diagrams: A Step-by-Step Approach
To effectively analyze a sequence diagram, follow a structured approach. This ensures you do not miss critical interactions or logic branches.
Step 1: Identify the Participants
Start at the top. List all lifelines. Determine which are external actors and which are internal system components. This sets the scope of the interaction.
Step 2: Trace the Main Success Path
Follow the solid arrows from the first actor to the final response. Ignore optional blocks for now. Focus on the happy path where everything works as expected. This gives you the core functionality.
Step 3: Analyze Activation Bars
Look at the rectangles on the lifelines. Identify which objects are busy and for how long. Long activation bars might indicate heavy processing or database waits.
Step 4: Examine Combined Fragments
Now, look at the dashed boxes. Read the alt, loop, and opt sections. Map out the alternative paths. Ask yourself: What happens if this condition fails?
Step 5: Verify Timing and Return Messages
Check the dashed return lines. Do they correspond to the messages sent? Ensure that every request has a response or a timeout mechanism implied.
🚧 Common Pitfalls and Best Practices
Even experienced developers can misinterpret sequence diagrams if they are not drawn clearly. Awareness of common issues helps in both reading and creating accurate documentation.
1. Avoiding Ambiguity
- Clear Labels: Every message should have a descriptive name. Avoid generic labels like
send(). - Consistent Naming: Use the same object names throughout the diagram.
- Logical Grouping: Use frames to group related interactions logically.
2. Managing Complexity
Sequence diagrams can become cluttered quickly. To maintain readability:
- Limit Scope: Do not try to show the entire system in one diagram. Break it down by feature or use case.
- Use References: If a sequence is complex, reference a separate diagram instead of drawing it inline.
- Minimalism: Only include interactions relevant to the specific use case being documented.
3. Timing Misconceptions
While sequence diagrams imply time flows from top to bottom, they do not strictly enforce timing constraints. They do not show milliseconds or exact delays. Do not infer precise latency from the vertical distance between messages.
4. Feedback Loops
Ensure feedback loops are clear. If a user action triggers a system update, show the confirmation message returning to the user. Missing return messages can make a process feel incomplete.
🔗 Integration with Other Diagrams
Sequence diagrams do not exist in isolation. They work best when integrated with other UML diagrams to provide a complete picture of the system.
- Class Diagrams: Use these to understand the attributes and methods available on the objects in the sequence diagram. Ensure the message names match the method signatures.
- State Machine Diagrams: Use these to define the internal states of objects that change during the sequence.
- Component Diagrams: Use these to understand the physical or logical deployment of the components interacting in the sequence.
By cross-referencing these diagrams, you ensure consistency between the structure of your system and its behavior.
🛠️ Practical Application in System Design
Applying this knowledge to real-world design improves collaboration. When architects draw these diagrams, they force a discussion about the order of operations. This often reveals hidden dependencies.
For example, a developer might assume an API call happens before a database transaction. The diagram forces them to decide. If the database transaction happens first, the API call might need to be asynchronous. This decision impacts system reliability.
Furthermore, sequence diagrams are excellent for testing. Testers can use the diagram to generate test cases. Each message represents a potential test scenario. Each fragment represents a branch to validate.
📝 Final Thoughts on Documentation
Documentation is a living process. Sequence diagrams should evolve as the system changes. If a new feature is added, the diagram must be updated. Outdated diagrams are worse than no diagrams at all because they mislead.
Focus on clarity over completeness. A diagram that is easy to read is more valuable than one that attempts to capture every edge case in a single view. Use fragmentation to keep the main flow clean while hiding complexity in specific blocks.
By understanding the syntax of lifelines, the semantics of messages, and the logic of control flow, you gain a powerful tool for system design. This skill bridges the gap between abstract requirements and concrete implementation.

