


Small and medium-sized enterprises operate under a unique set of pressures. Unlike large corporations with dedicated strategy departments and vast data repositories, SMEs must navigate market shifts with limited bandwidth and tighter budgets. Strategic planning is often viewed as a luxury reserved for the well-funded. However, ignoring external factors is a risk no business can afford. The challenge lies in adapting rigorous frameworks to fit the reality of a small team.
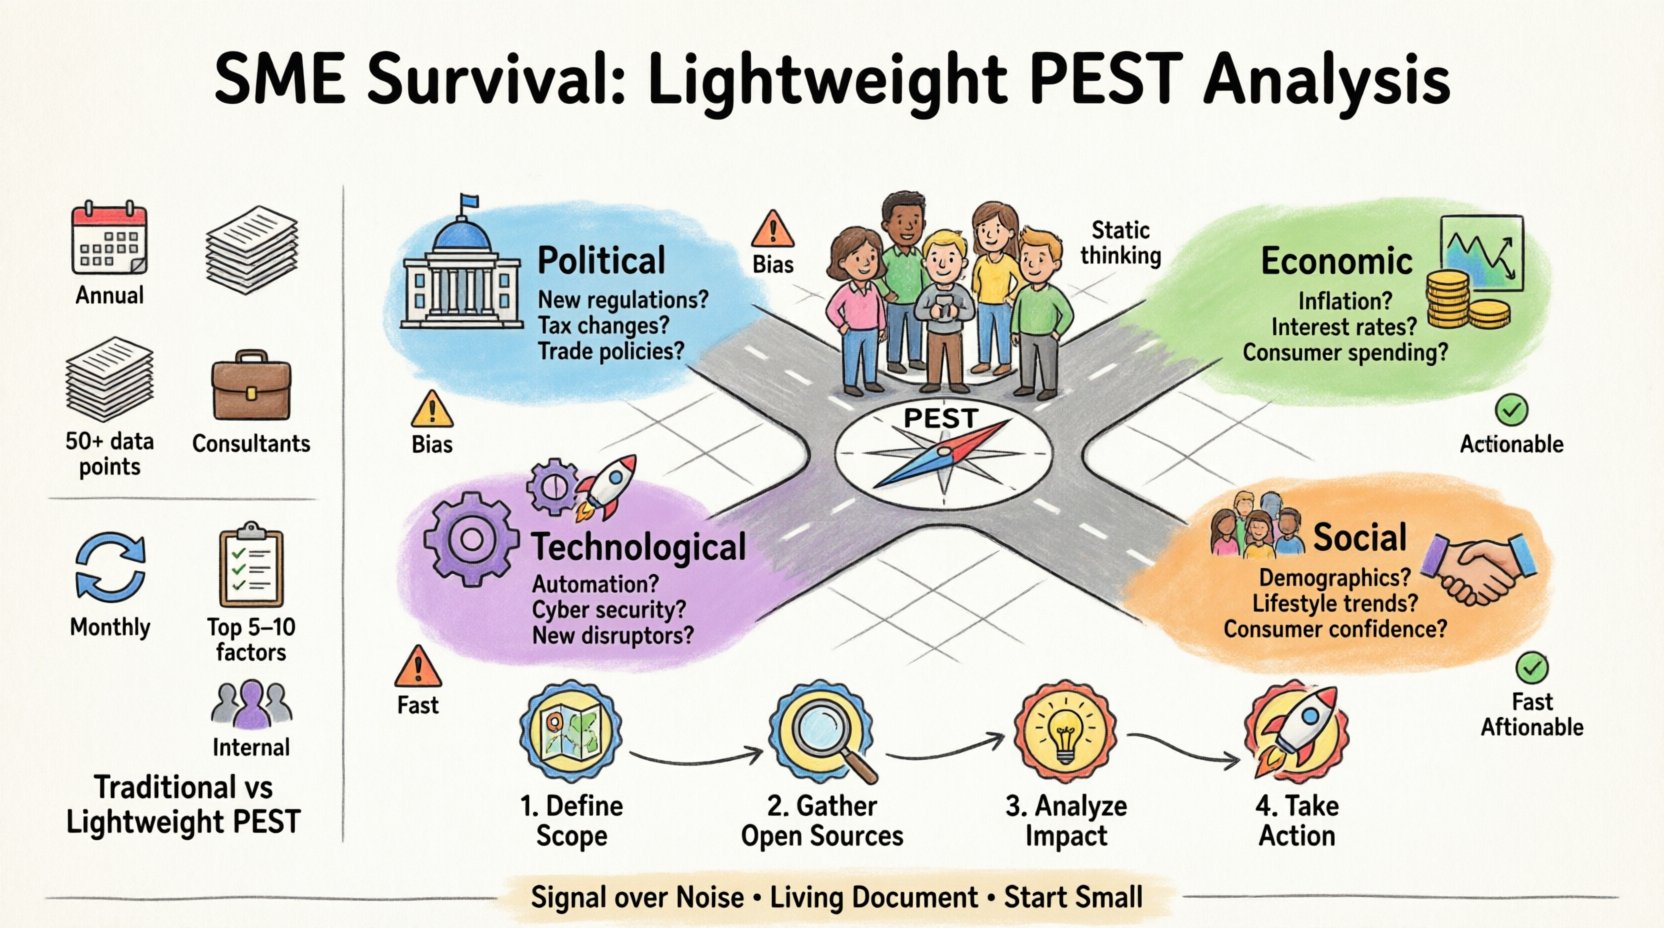
The PEST analysis (Political, Economic, Social, Technological) is a standard tool for environmental scanning. Traditionally, it is a heavyweight process involving extensive research, long meetings, and complex reporting. For a resource-constrained team, this traditional approach can feel like a distraction from the core work of keeping the lights on. Yet, the need to understand the external environment remains critical. The solution is not to abandon the framework, but to streamline it.
This guide outlines a lightweight approach to PEST analysis designed specifically for small teams. It focuses on actionable intelligence rather than academic perfection. By adopting this method, you can identify risks and opportunities without derailing daily operations. Let us explore how to build resilience through focused environmental scanning.
Why Standard PEST Fails Small Teams 🛑
Before implementing a new approach, it is necessary to understand why the conventional method often falls short for smaller organizations. Standard strategic planning tools are designed for scale. They assume resources that simply do not exist in an SME context. Recognizing these friction points helps in avoiding common pitfalls.
- Time Consumption: A traditional PEST analysis can take weeks. Small teams operate in weeks, not months. The data gathered by the time the analysis is complete may already be obsolete.
- Data Overload: Collecting every piece of information regarding politics or technology leads to analysis paralysis. Small businesses need clear signals, not noise.
- Lack of Expertise: Large firms have lobbyists and industry analysts. SMEs rely on the generalist knowledge of their founders and managers. Deep dives into macroeconomic theory are often unnecessary.
- Cost of Tools: Enterprise-grade market research software is expensive. Small teams must rely on free or low-cost information sources.
When a framework becomes a burden, it ceases to be a tool and becomes a barrier. The goal of this lightweight approach is to reduce the friction of strategic thinking while retaining the core value of external awareness.
The Lightweight Framework Explained 🛠️
This approach strips away the non-essential elements of the PEST analysis. It focuses on immediate relevance and high-impact factors. Instead of a 50-page report, the output is a one-page summary or a short discussion document. The process is iterative, meaning it is reviewed regularly rather than performed as a one-off event.
The core philosophy is signal over noise. You are looking for changes that directly affect your revenue, costs, or operational capacity. If a political shift in a distant country does not impact your supply chain, it does not belong in the analysis.
| Traditional PEST | Lightweight PEST |
|---|---|
| Quarterly or Annual | Monthly or Quarterly |
| External Consultants | Internal Team |
| 50+ Data Points | Top 5-10 Critical Factors |
| Static Report | Living Document |
| Academic Rigor | Practical Application |
By shifting the focus to agility, the analysis becomes a living part of your workflow rather than a compliance exercise. This ensures that the insights remain fresh and useful for decision-making.
Step-by-Step Implementation Guide 📝
Implementing this framework requires a structured but flexible process. Below is a breakdown of how to conduct the analysis without overwhelming your team. Each step is designed to be completed in a focused session.
1. Define the Scope and Timeframe 🗓️
Before gathering data, clarify what you are looking at. A vague scope leads to vague results. For an SME, the horizon should typically be 6 to 12 months. Anything beyond that is too speculative for immediate action.
- Geographic Scope: Are you selling locally, nationally, or globally? Focus on regions where you have active operations.
- Industry Scope: Identify the specific sector regulations and trends that apply to your niche.
- Resource Allocation: Assign a team member to lead the session. It does not need to be the CEO, but it must be someone with authority to act on findings.
2. Gather Information from Open Sources 📡
You do not need paid subscriptions to gather strategic data. Government publications, news outlets, and industry reports are often free. The key is knowing what to read.
- Government Websites: Look for press releases regarding tax changes, trade tariffs, or labor laws.
- News Aggregators: Set up alerts for keywords related to your product and market.
- Customer Feedback: Your clients are often the first to know about economic shifts or social trends affecting their purchasing power.
- Competitor Moves: Watch how competitors are adapting to the environment. Their actions are often a reaction to the same factors you are studying.
3. Analyze the P-E-S-T Components 🔍
This is the core of the process. Use a dedicated session to brainstorm factors for each category. Do not aim for completeness; aim for impact. Use the table below as a checklist to guide your thinking.
Political Factors (P) ⚖️
These are government actions that influence your business. For an SME, these are often the most immediate risks.
- Regulatory Changes: Are new compliance requirements coming that will increase your operational costs?
- Taxation: Is there a change in corporate tax rates or VAT thresholds that affects pricing?
- Trade Policies: If you import materials, are there tariffs or trade barriers emerging?
- Stability: Is the local government stable, or is there political unrest that could disrupt supply chains?
Economic Factors (E) 💰
Economic conditions determine whether customers can buy what you sell. This section focuses on purchasing power and cost of capital.
- Inflation Rates: Rising prices increase your costs. Can you pass this on to customers?
- Interest Rates: Are loans becoming more expensive? This affects expansion plans and cash flow.
- Unemployment: High unemployment can mean cheaper labor, but it also reduces overall consumer spending.
- Exchange Rates: If you deal with international currency, volatility can wipe out margins overnight.
Social Factors (S) 👥
Social trends reflect the demographics and cultural attitudes of your market. Understanding these helps you tailor your offering.
- Demographics: Is your customer base aging or growing younger? This changes your communication style.
- Lifestyle Changes: Are people working remotely more? Do they value sustainability over price?
- Health & Safety: Are there new public health concerns that affect how you operate?
- Consumer Confidence: Are people feeling optimistic about the future, or are they saving money?
Technological Factors (T) 📱
Technology disrupts industries. For SMEs, it is often the biggest lever for efficiency or the biggest threat to obsolescence.
- Automation: Are new tools available that can reduce your labor costs?
- Security: Are cyber threats increasing that require better investment in data protection?
- Adoption Rates: Is your target market adopting new platforms (e.g., mobile-first)?
- Disruptors: Are startups entering your space with a new business model?
Turning Analysis into Action 🚀
Collecting data is useless without action. A lightweight analysis is only valuable if it influences decisions. The transition from insights to execution is where many small businesses fail. They gather information and file it away.
To ensure the analysis drives value, follow these steps:
- Prioritize Findings: Rank the identified factors by impact and probability. Focus on the top three risks and top three opportunities.
- Assign Ownership: Who is responsible for monitoring each factor? For example, the Finance Manager should watch economic indicators, while the Marketing Lead watches social trends.
- Adjust Strategy: If a political factor increases your costs, adjust your pricing model. If a technological factor offers efficiency, allocate budget for implementation.
- Communicate Internally: Share the summary with the whole team. Transparency builds alignment and ensures everyone is aware of the external landscape.
Common Pitfalls to Avoid ⚠️
Even with a streamlined approach, errors can occur. Being aware of these common mistakes helps maintain the integrity of the process.
- Confirmation Bias: Only looking for information that supports what you already want to do. Challenge your assumptions actively.
- Internal Focus: Spending too much time discussing internal strengths and weaknesses. PEST is about the external environment.
- Static Thinking: Treating the analysis as a one-time event. Markets change weekly. The document must be updated.
- Ignoring Weak Signals: Dismissing small trends because they seem insignificant now. Small shifts often precede major market changes.
- Over-Reliance on History: Assuming the past predicts the future. Economic cycles and social trends are evolving rapidly.
Data Sources for Resource-Constrained Teams 📚
You do not need expensive databases to gather intelligence. The following sources provide high-quality information at little to no cost.
| Category | Source Type | Cost |
|---|---|---|
| Political | Government Publications | Free |
| Economic | Central Bank Reports | Free |
| Social | Demographic Census Data | Free |
| Technological | Industry Blogs & Forums | Free |
| General | News Aggregators | Free / Low |
Utilizing these sources requires discipline. Set aside time each week to scan these feeds. Consistency is more valuable than intensity. A small amount of information gathered regularly is better than a massive dump once a year.
Integrating with Existing Planning Cycles 🔗
Do not create a separate silo for this analysis. Integrate it into your existing business rhythms. If you hold quarterly planning meetings, include a PEST review as the first agenda item. This ensures that strategy is always informed by the environment.
For cash flow forecasting, use the Economic factors to adjust assumptions. If inflation is high, adjust your cost projections upward. If unemployment is low, adjust your hiring budget. This creates a direct link between the analysis and your financial health.
Reviewing and Updating the Framework 🔄
The lightweight nature of this approach allows for flexibility. If a major event occurs, such as a sudden regulatory change or a global pandemic, the analysis should be triggered immediately. Do not wait for the scheduled cycle.
Establish a review cadence that matches your business speed.
- High-Velocity Markets: Review monthly. Technology and fashion industries change rapidly.
- Stable Markets: Review quarterly. Manufacturing or utility sectors may require less frequent updates.
- Post-Event: Review immediately after any major disruption.
Keep the document accessible. Store it in a shared drive where the entire leadership team can view and comment. Version control is important. Label documents by date and version number to track how your understanding of the environment has evolved.
Building a Culture of External Awareness 🌍
The most successful SMEs are those where every team member understands the external landscape. This analysis should not be the secret of the CEO. When the whole team understands the political, economic, social, and technological pressures, they make better decisions in their daily tasks.
Encourage staff to share relevant news. If a receptionist reads about a new safety regulation, that is valuable information. Create a channel or a meeting slot where team members can share one piece of external news they found relevant. This democratizes the intelligence gathering process and reduces the burden on leadership.
Measuring the Value of the Analysis 📏
How do you know if this lightweight PEST analysis is working? You measure it by the decisions it influences.
- Decision Velocity: Are you making decisions faster because you understand the environment?
- Risk Avoidance: Have you avoided a costly mistake by anticipating a change?
- Opportunity Capture: Did you launch a product or service because you saw a social trend coming?
- Team Alignment: Is everyone on the same page regarding market challenges?
If the analysis sits in a drawer, it has failed. If it is referenced in budget meetings, strategy sessions, and daily stand-ups, it is succeeding. The value is in the application, not the documentation.
Conclusion on Sustainability 🌱
Strategic planning does not have to be a heavy burden. By adopting a lightweight PEST analysis, resource-constrained teams can gain the same clarity as large corporations without the overhead. The focus remains on what matters: the factors that impact survival and growth.
Start small. Pick one category to analyze next month. Gather the free data available. Discuss it with your team. Act on what you find. As you build the habit, the process will become more robust. The goal is not perfection; it is awareness. In a volatile market, awareness is the first step toward resilience.

