


Introduction: Why I Finally Took ER Diagrams Seriously
As someone who’s spent years wrestling with database schemas, I’ll admit: I used to treat Entity Relationship Diagrams (ERDs) as optional documentation—something to sketch quickly before diving into code. That changed after a particularly painful production database migration that could have been avoided with proper modeling.
This guide shares my hands-on experience learning, applying, and ultimately appreciating ERDs as an essential tool in my software development workflow. Whether you’re a junior developer, a product manager, or a seasoned architect, I hope my practical insights help you avoid the same headaches I encountered. Let’s walk through what ERDs really are, when they matter most, and how to use them effectively—based on real projects, not just theory.

What Is an Entity Relationship Diagram (ERD)? A Practitioner’s Perspective
When I first encountered ERDs, the academic definition felt abstract: “a structural diagram for database design.” But in practice, an ERD is simply a visual map of your data landscape. It shows:
-
The major entities (business objects like
Customer,Order,Product) -
Their attributes (properties like
customer_id,order_date,price) -
How they connect (relationships like “a Customer places many Orders”)

What clicked for me was realizing ERDs aren’t just for database engineers. They’re a communication tool. When I started sharing ERDs with product managers and QA teams, misalignments about data requirements dropped dramatically. The visual nature makes complex relationships instantly understandable—even to non-technical stakeholders.
When I Actually Use ER Diagrams (And When I Don’t)
Through trial and error, I’ve learned ERDs aren’t always necessary—but they’re invaluable in specific scenarios:
✅ Database Design & Refactoring
Before altering a production database, I now always draft an ERD. Visualizing changes first helps me spot circular dependencies, missing foreign keys, or normalization issues. One time, this saved me from accidentally deleting a critical junction table.
✅ Debugging Complex Queries
When troubleshooting slow joins across 10+ tables, I pull up the ERD. Seeing the full schema visually helps me trace data flow faster than scrolling through SQL scripts.
✅ Onboarding New Team Members
I’ve used ERDs as “data onboarding” docs. New engineers grasp our system architecture 3x faster with a well-labeled diagram versus reading raw schema files.
✅ Requirements Gathering
Early in projects, I sketch a conceptual ERD with stakeholders. It forces clarity: “Wait—does a User really need multiple Profiles, or is that a separate feature?” Catching these questions early prevents costly rework.
ERD Notations Decoded: What Those Symbols Actually Mean
Early on, I struggled with ERD notation variations. Here’s what finally made sense to me:
Entities: The “Nouns” of Your System
An entity is any definable business concept. In my diagrams, I use rounded rectangles:

Pro tip: If you can’t describe it in one word (e.g., Invoice, Shipment), it might be too vague for an entity.
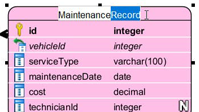
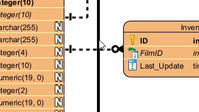
Attributes: The Details That Matter
Attributes live inside the entity shape. I always include:
-
Data types (
VARCHAR,INT) -
Nullable flags
-
Default values (when known)

Primary Keys (PK)
I mark PKs with 🔑 or underline them. Critical reminder: PKs must be unique. I once wasted hours debugging because two test records shared a PK value.

Foreign Keys (FK)
FKs show relationships. I annotate them with → referenced_table.column. Unlike PKs, FKs can repeat—that’s how one-to-many relationships work.

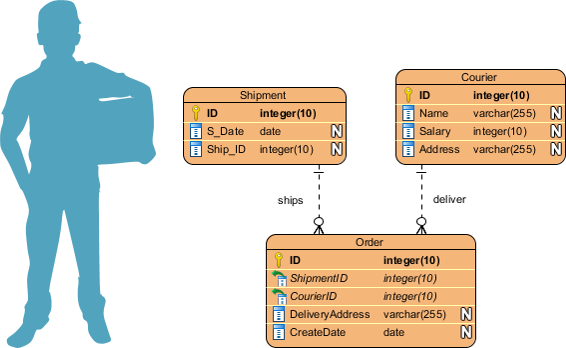
Relationships & Cardinality: The “Verbs”
Connectors between entities show how data interacts. The crow’s foot notation took practice, but now I read it intuitively:
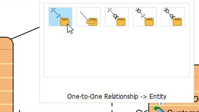
One-to-One
Rare, but useful for splitting sensitive data (e.g., User ↔ UserCredentials).

One-to-Many
My most common pattern. Example: One Category has many Products.

Many-to-Many
Requires a junction table in physical models. I initially missed this and created invalid schemas—learn from my mistake!

Conceptual vs. Logical vs. Physical Models: Choosing the Right Abstraction
I used to mix these levels and create confusing diagrams. Now I match the model to my audience:
| Feature | Conceptual | Logical | Physical |
|---|---|---|---|
| Entity Names | ✅ | ✅ | ✅ |
| Relationships | ✅ | ✅ | ✅ |
| Columns | ❌ | ✅ | ✅ |
| Data Types | ❌ | Optional | ✅ |
| PK/FK | ❌ | ❌ | ✅ |
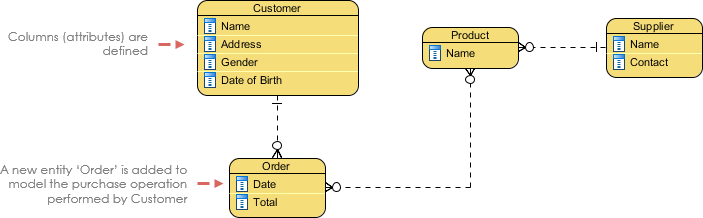
Conceptual Model: The “Big Picture”
I use this with business stakeholders. No technical details—just core entities and high-level relationships. Great for aligning on scope.

Note: Only conceptual ERDs support generalization (e.g., Triangle is a kind of Shape).
Logical Model: Adding Structure
Here, I define attributes and relationships precisely—but stay DBMS-agnostic. This is my “source of truth” before engineering handoff.
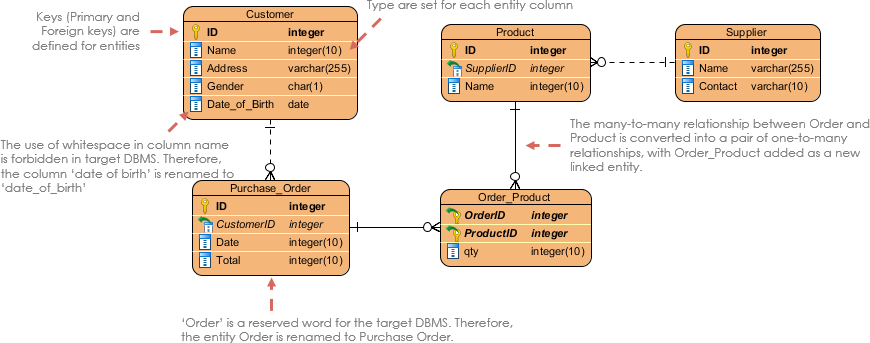
Physical Model: Ready for Implementation
This is where I add DB-specific details: VARCHAR(255), NOT NULL, indexes. I always validate against my target DBMS (PostgreSQL, MySQL, etc.) to avoid deployment surprises.
My Step-by-Step Process for Drawing Effective ERDs
After many iterations, this workflow saves me time and reduces errors:
-
Clarify the goal: Am I designing a new system? Documenting legacy tech? The purpose dictates detail level.
-
Define scope boundaries: I list in-scope entities upfront to avoid feature creep in the diagram.
-
Sketch major entities first: Start with core business objects (
User,Order,Product). -
Add attributes incrementally: Begin with PKs and critical fields; expand later.
-
Validate data coverage: “Can this schema store all required business data?” If not, iterate.
-
Map relationships with cardinality: Be explicit—
1:MvsM:Nchanges implementation drastically. -
Apply normalization: I check for repeating groups (e.g., multiple
phone_numberfields) and split them into related entities.
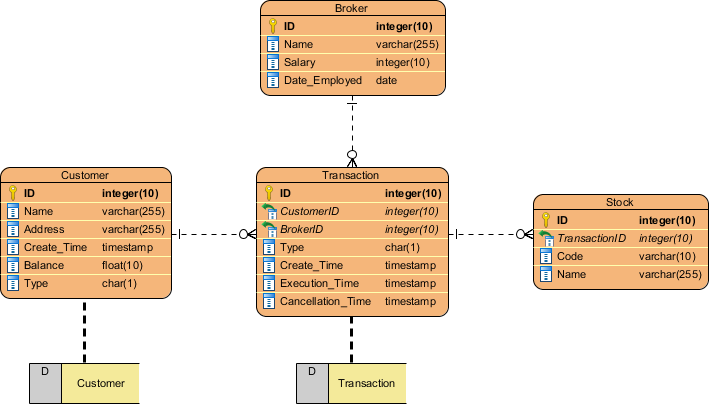
Real-World ERD Examples That Shaped My Understanding
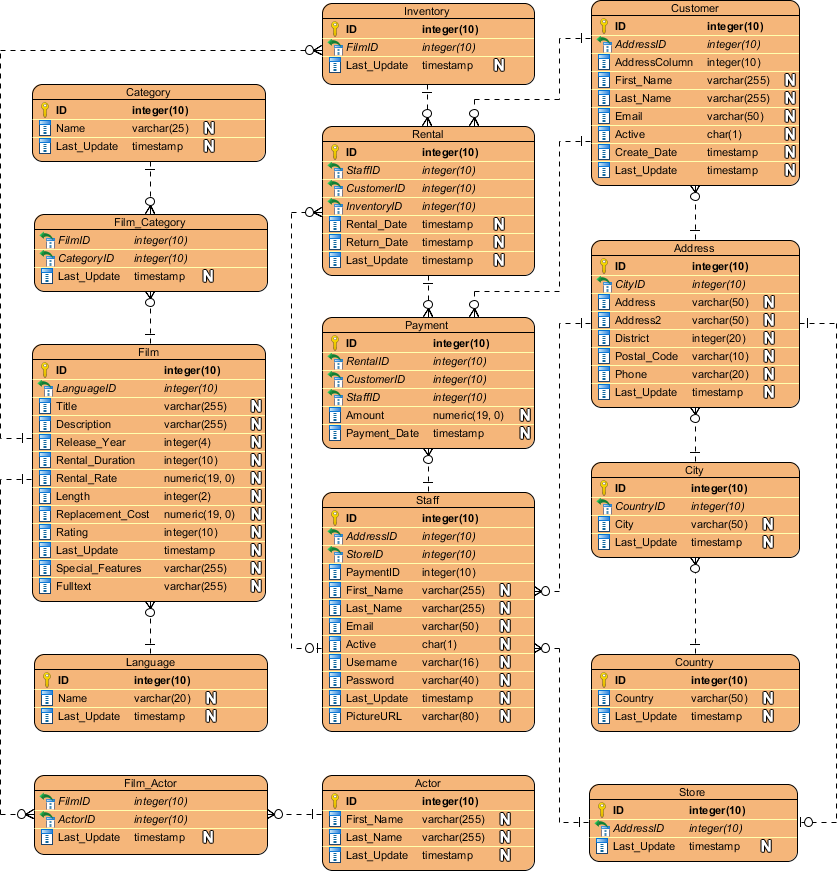
Movie Rental System
This example taught me how to model time-based relationships (e.g., rental periods).
Loan System
Here, I learned to handle financial constraints: interest calculations, payment schedules, and status transitions.

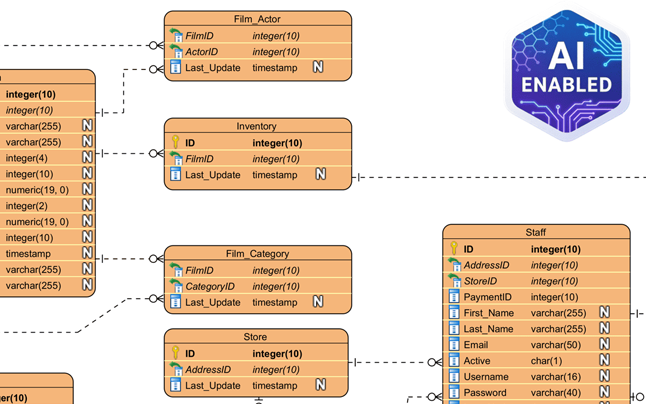
Online Shop
My go-to reference for e-commerce patterns: carts, inventory, and order fulfillment workflows.

Integrating ERDs with Other Modeling Techniques
ERD + Data Flow Diagrams (DFD)
When mapping system processes, I align ERD entities with DFD data stores. This shows both structure and flow.

ERD + BPMN Business Process Diagrams
For workflow design, I link BPMN data objects to ERD entities. This clarifies how business processes consume/produce data.


Tooling: What I Actually Use for ERD Creation (No Vendor Bias)
I’ve tested many ERD tools. Here’s my honest take:
For Quick Prototyping: Visual Paradigm Online
-
✅ Browser-based, zero install
-
✅ Real-time collaboration (great for remote teams)
-
✅ AI-assisted generation from text prompts
-
❌ Limited offline access

For Enterprise Projects: Visual Paradigm Desktop
-
✅ Reverse-engineer existing databases
-
✅ Generate DDL scripts for multiple DBMS
-
✅ Advanced normalization checks
-
❌ Steeper learning curve
Features That Saved Me Time:
-
Inline editing: Modify attributes directly on canvas—no modal popups.
-
Smart connectors: Auto-snap relationships without manual alignment.
-
Auto-layout: Clean up messy diagrams in one click.
AI Assistance: A Game-Changer?
I was skeptical, but describing “a hospital management system with patients, doctors, and appointments” and getting a normalized ERD draft in seconds? Impressive. I still review and refine the output, but it jumpstarts the process.

Round-Trip Engineering
My favorite feature: sync diagrams with live databases. Change the ERD → auto-generate migration scripts. Reverse-engineer a legacy DB → get a visual model. This bidirectional sync prevents “diagram drift.”
Conclusion: Why ERDs Earned a Permanent Spot in My Toolkit
Looking back, my initial reluctance to use ERDs cost me time, introduced bugs, and created team misalignment. Today, I consider them non-negotiable for any non-trivial data project.
ERDs aren’t about perfect diagrams—they’re about clearer thinking. They force you to confront data relationships early, communicate intent visually, and build systems that scale. Whether you use a free tool like Visual Paradigm Community Edition or invest in enterprise features, the ROI comes from the discipline of modeling, not the software itself.
If you’re on the fence: start small. Sketch one core workflow as an ERD. Share it with a colleague. Iterate. You might be surprised how quickly this “extra step” becomes your most valuable time-saver.
References
- ERD Tool Solutions Overview: Comprehensive guide to Entity Relationship Diagram tools, featuring AI-powered modeling, database engineering capabilities, and platform comparisons for desktop and cloud-based workflows.
- Database Design with ERD Tools: Feature showcase for professional ERD modeling, including forward/reverse engineering, DDL generation, and support for multiple database management systems.
- OpenDocs ERD AI Generation Release: Announcement detailing AI-powered ERD generation within documentation tools, enabling embedded database diagrams in technical specifications.
- AI Diagram Generation Features: Overview of text-to-diagram capabilities, allowing users to generate ERDs and other models from natural language descriptions.
- ERD Tool Solutions (Traditional Chinese): Localized resource covering ERD modeling features and database design workflows for Traditional Chinese-speaking users.
- Chen Notation ERD Editor: Specialized tool support for Chen notation in conceptual data modeling, useful for academic and detailed business analysis contexts.
- AI Diagram Generator: DFD & ERD Updates: Release notes covering expanded AI support for Data Flow Diagrams and Entity Relationship Diagrams.
- ERD Tool Solutions (Simplified Chinese): Localized resource covering ERD modeling features and database design workflows for Simplified Chinese-speaking users.
- Visual Paradigm Pricing & Editions: Details on licensing options, including the free Community Edition and paid Modeler/Enterprise tiers with advanced ERD features.
- Getting Started with AI Features: Technical guide for enabling and using AI-assisted modeling tools within Visual Paradigm Desktop and Online.
- OpenDocs Developer Guide: AI-Powered Documentation: Third-party tutorial covering integration of AI-generated ERDs into technical documentation workflows.
- AI Process Overview: Diagram Generator: Step-by-step workflow guide for using AI to accelerate diagram creation, including ERDs and business process models.
- What Is an Entity Relationship Diagram? (Guide): Foundational tutorial covering ERD concepts, notations, modeling levels, and practical drawing techniques.
- Data Modeling: Data Dictionary Tutorial: Guide to synchronizing ERD models with data dictionaries for consistent metadata management across teams.