
Strategic planning relies heavily on frameworks that simplify complex environments into manageable data points. The PEST analysis is one of the most ubiquitous tools in this toolkit. It stands for Political, Economic, Social, and Technological factors. However, there is a pervasive belief that simply listing these factors constitutes a complete analysis. This is a misconception that often leads to flawed strategic decisions.
Many organizations treat PEST as a static checklist. They fill out the four quadrants once a year, file the document, and move forward. This approach ignores the dynamic nature of the business environment. When the external landscape shifts rapidly, a static document becomes obsolete immediately. To navigate uncertainty effectively, one must understand the limitations of the traditional model and apply a more rigorous methodology.
🚫 The Common Myths Surrounding PEST Analysis
Before correcting the approach, it is necessary to identify the specific myths that undermine the process. These misconceptions create blind spots that can derail long-term planning.
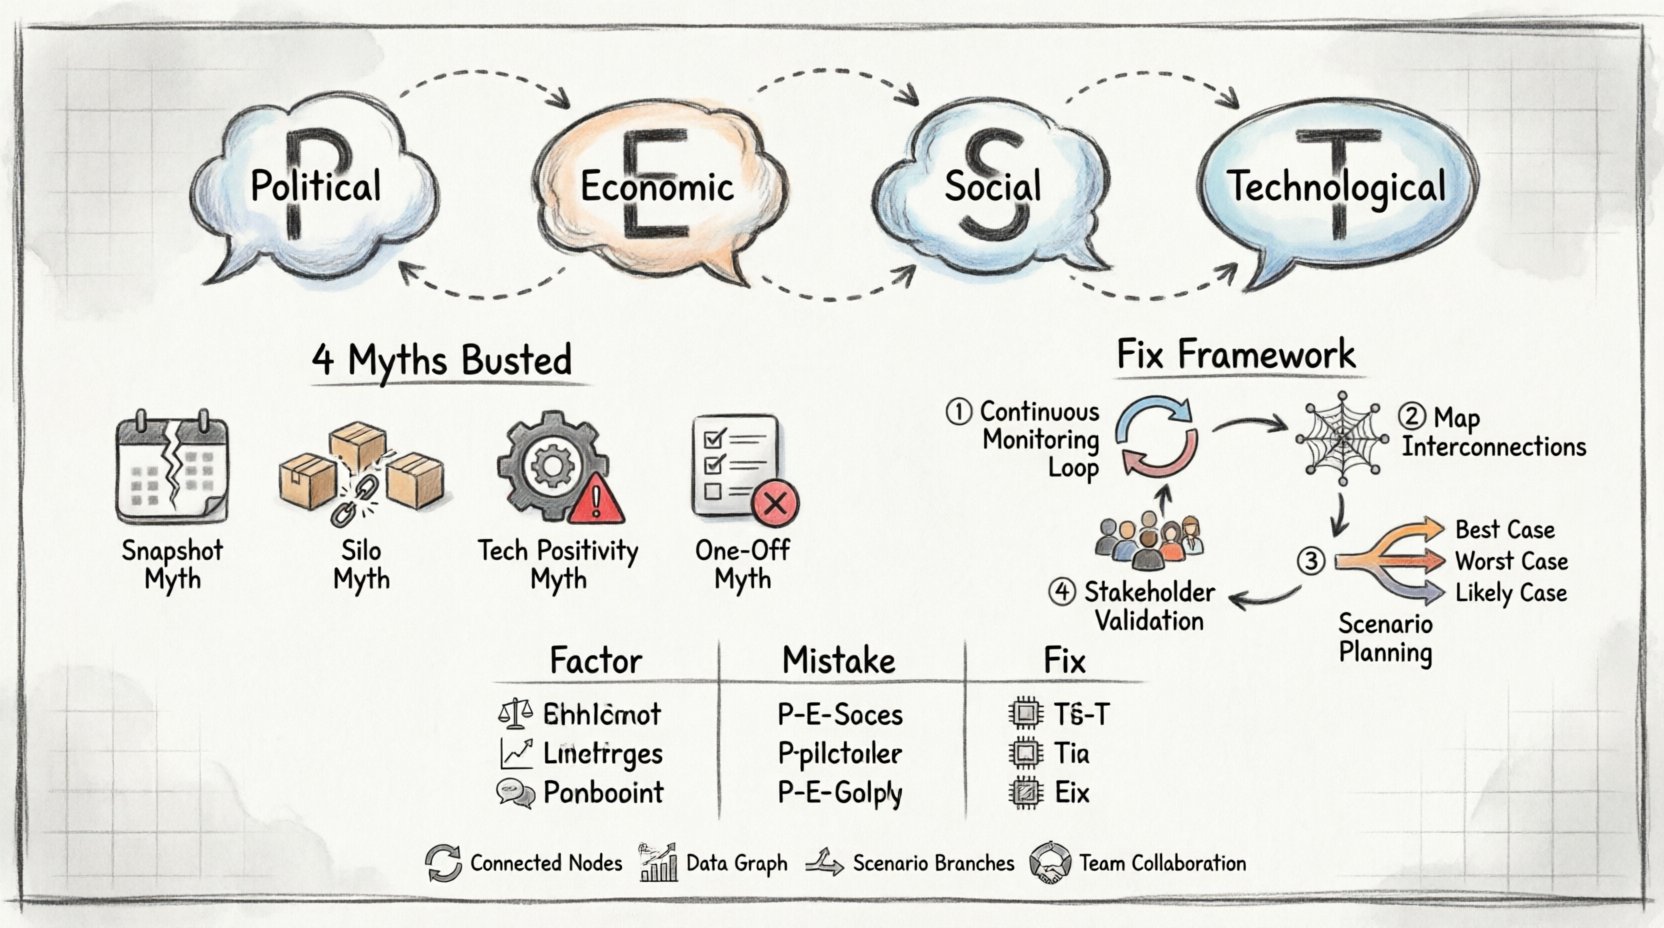
- Myth 1: The Snapshot is Permanent. Many assume that the data collected today will remain relevant for the next fiscal quarter. External factors are fluid. Political policies change with elections. Economic indicators fluctuate with global markets. Social trends evolve with cultural shifts.
- Myth 2: The Factors are Isolated. It is common to analyze Political factors separately from Economic ones. In reality, a new trade tariff (Political) immediately impacts import costs (Economic) and consumer sentiment (Social). Treating them in silos misses critical interdependencies.
- Myth 3: Technology is Always Positive. There is a tendency to view technological advancements purely as opportunities. Disruptive technology can also render existing business models obsolete. It is not just about adoption; it is about displacement.
- Myth 4: It is a One-Off Exercise. Some treat PEST as a quarterly task. Strategic environments require continuous monitoring. A one-time report cannot capture the trajectory of change.
⚠️ Why Your Analysis Might Be Failing
When a strategic plan based on PEST analysis fails to predict market shifts, it is often due to the quality of the input or the interpretation of the output. Below are the specific reasons why these analyses often miss the mark.
1. Outdated Data Sources
Reliance on historical data is a primary pitfall. Economic forecasts from three years ago do not reflect current inflation rates or supply chain disruptions. Social sentiment analysis based on old surveys ignores current cultural movements. You must prioritize real-time data streams over static reports.
2. Lack of Contextual Depth
Listing “High Inflation” under Economic is not an analysis. It is a headline. An effective analysis explains why inflation is high and how it impacts specific operational costs. It requires connecting the macro trend to the micro reality of the organization.
3. Ignoring Local Nuances
Global trends do not always apply to local markets. A technological shift that dominates the United States might be irrelevant in a region with different infrastructure. A political regulation in one jurisdiction might not exist in another. Generalizing without localization reduces accuracy.
4. Confirmation Bias
Analysts often look for data that supports a preconceived strategy. If leadership wants to expand into a new market, the PEST analysis might inadvertently highlight favorable factors while downplaying risks. This creates a false sense of security.
🛠️ How to Fix It: The Corrective Framework
Fixing the PEST analysis requires shifting from a descriptive exercise to a predictive and integrative one. The goal is not just to list factors, but to understand their impact on the business model.
Step 1: Establish a Continuous Monitoring Loop
Instead of an annual review, set up a quarterly refresh of the PEST data. This ensures that the strategic plan is built on current information. Create a system where key indicators are tracked regularly. This could involve monitoring government gazettes, economic indices, social media sentiment, and patent filings.
Step 2: Map Interconnections
Draw lines between factors. Show how a change in one area triggers a reaction in another. For example, how does a change in interest rates (Economic) affect the cost of borrowing for technology upgrades (Technological)? Visualizing these connections reveals hidden risks and opportunities.
Step 3: Scenario Planning
Don’t just predict one future. Develop multiple scenarios based on the PEST factors.
- Best Case: Favorable political stability and rapid tech adoption.
- Worst Case: Regulatory crackdown and economic recession.
- Most Likely: Moderate growth with specific regulatory hurdles.
This prepares the organization to pivot quickly when reality aligns with one of these scenarios.
Step 4: Validate with Stakeholders
Bring in diverse perspectives. The sales team sees social trends differently than the legal team sees political risks. Cross-functional validation ensures that the analysis is not skewed by departmental blind spots.
📊 Deep Dive: Factor-Specific Pitfalls and Fixes
Each component of the PEST framework has unique challenges. Addressing them individually ensures a robust overall analysis.
| Factor | Common Mistake | Correct Approach |
|---|---|---|
| Political | Assuming stability. | Map policy volatility and regulatory risk exposure. |
| Economic | Using national averages. | Focus on sector-specific economic indicators. |
| Social | Ignoring demographic shifts. | Analyze generational changes in consumer behavior. |
| Technological | Focusing only on adoption. | Assess disruption potential and obsolescence risk. |
Political Factors
Political analysis often focuses on current leadership. This is insufficient. It must include the stability of the regulatory environment. Consider tax policies, trade restrictions, and labor laws. A change in administration can alter the entire operating landscape. Evaluate the risk of policy reversal.
Economic Factors
Avoid relying solely on GDP growth. Look at purchasing power parity, currency exchange volatility, and interest rate trends. For a business with global supply chains, currency fluctuation is more critical than local GDP. Understand the liquidity of your target market.
Social Factors
Demographics are not static. Population aging, urbanization, and education levels shift over decades. Social factors also include cultural attitudes towards work, health, and sustainability. A brand that ignores the shift towards remote work or ethical consumption risks alienating its customer base.
Technological Factors
Technology moves faster than business cycles. Analyze the rate of innovation in your specific industry. Consider automation, artificial intelligence, and data security regulations. The question is not just “Is this technology available?” but “Is this technology becoming the standard?”
🧠 Implementation: Making It Actionable
An analysis that sits on a shelf is useless. To ensure the PEST analysis drives action, integrate it into the decision-making process.
- Link to KPIs: Connect external factors to internal performance metrics. If inflation rises (Economic), how does it impact profit margins? Set thresholds that trigger strategic reviews.
- Assign Ownership: Designate a team member to monitor specific factors. This prevents the “everyone’s job means no one’s job” scenario.
- Regular Review Cycles: Schedule dedicated meetings to discuss the PEST data. Do not bury it in a larger annual report. Keep it visible.
- Test Assumptions: Explicitly state the assumptions driving your strategy. If the assumption is “Interest rates will remain low,” have a plan for when they rise.
🌍 The Bigger Picture: Strategic Resilience
The ultimate goal of refining your PEST analysis is not just accuracy, but resilience. In an unpredictable world, the ability to anticipate change is a competitive advantage. By correcting the common errors and adopting a dynamic approach, you transform a simple checklist into a strategic compass.
Remember that no framework is perfect. The value lies in the rigor of the thinking process. A flawed analysis that is frequently updated is better than a perfect analysis that is never touched. Prioritize the quality of the data and the depth of the insight over the length of the report.
When you strip away the myths, the PEST analysis remains a powerful tool. It forces you to look outward before looking inward. It ensures that your strategy is grounded in the reality of the market rather than the comfort of internal assumptions. By acknowledging the pitfalls and applying the corrective measures outlined above, you can build a strategic foundation that withstands external shocks.
🔎 Summary of Key Takeaways
- Dynamic over Static: Treat PEST as a living document, not a one-time report.
- Interconnected: Recognize how factors influence one another.
- Data Quality: Prioritize real-time, relevant data over historical averages.
- Scenario Planning: Prepare for multiple futures, not just one predicted path.
- Stakeholder Input: Validate findings across different departments.
Strategic clarity comes from a disciplined approach to external analysis. By avoiding the traps of superficiality and isolation, you ensure that your business remains aligned with the shifting tides of the global environment. This is the path to sustainable growth and long-term viability.

