


Unified Modeling Language (UML) provides a standardized notation for visualizing, specifying, constructing, and documenting the artifacts of software systems. Among the various diagram types, behavioral diagrams stand out for their ability to describe the dynamic aspects of a system. These models capture how the system behaves over time, how data flows between objects, and how states change in response to events.
When designing complex systems, selecting the correct behavioral model is critical. Using the wrong diagram can lead to ambiguity, implementation errors, or a lack of clarity among stakeholders. This guide explores three primary UML behavioral models: the Sequence Diagram, the Activity Diagram, and the State Machine Diagram. By understanding their unique strengths and limitations, architects and developers can choose the tool that best fits their specific context.
Understanding Sequence Diagrams ⏱️
The Sequence Diagram is one of the most recognizable artifacts in UML. It focuses on the interaction between objects or components in a time-ordered sequence. This diagram visualizes how messages pass between different participants to achieve a specific functionality.
Core Components of a Sequence Diagram
- Lifelines: Represent the participants in the interaction, typically objects or actors. These are vertical lines extending downwards from the top of the diagram.
- Messages: Horizontal arrows indicating communication between lifelines. They can be synchronous (blocking) or asynchronous (non-blocking).
- Activation Bars: Rectangles placed on lifelines to show when an object is actively performing an operation.
- Combined Fragments: Boxes that group parts of the diagram to show loops, choices, or optional behavior.
When to Use a Sequence Diagram
Sequence diagrams excel when the focus is on the order of events and the flow of control between distinct entities. They are particularly effective for:
- Designing API interactions and microservice communication.
- Documenting user journeys through a system interface.
- Debugging complex logic by tracing the exact path of execution.
- Visualizing the lifecycle of a specific transaction or request.
Limitations of Sequence Diagrams
While powerful for interactions, sequence diagrams have boundaries:
- Complexity: They can become cluttered when modeling systems with high concurrency or complex branching logic.
- State Awareness: They do not inherently show the internal state of an object. They show behavior but not the conditions under which that behavior changes.
- Granularity: They often require abstraction to remain readable. Modeling every single step in a large system can render the diagram useless.
Understanding Activity Diagrams 🔄
The Activity Diagram is the UML equivalent of a flowchart. It describes the flow of control from activity to activity within a system. It is ideal for modeling business workflows, algorithms, and the logic behind a specific use case.
Core Components of an Activity Diagram
- Activity Nodes: Represent specific steps or actions in the process.
- Control Flow: Arrows connecting nodes to define the order of execution.
- Decision Nodes: Diamond shapes representing points where the flow can branch based on conditions.
- Fork and Join Nodes: Symbols indicating parallel processing or the synchronization of concurrent threads.
- Swimlanes: Horizontal or vertical bands that organize activities by responsibility (e.g., user, system, database).
When to Use an Activity Diagram
Activity diagrams are the go-to choice when the focus is on workflow and process logic:
- Mapping out business processes involving multiple departments.
- Designing complex algorithms with multiple decision points.
- Visualizing parallel processes and concurrency requirements.
- Documenting the steps required to complete a specific task end-to-end.
Limitations of Activity Diagrams
Despite their versatility, activity diagrams face specific challenges:
- Interaction Detail: They do not show object lifetimes or the specific sequence of method calls between objects as clearly as sequence diagrams.
- State Representation: They show actions, but not the persistent states of the objects performing those actions.
- Readability: Large workflows can become spaghetti-like diagrams if not carefully organized using swimlanes.
Understanding State Machine Diagrams 🧱
A State Machine Diagram (often just called a State Diagram) models the life cycle of a single object or a system component. It defines the various states an entity can occupy and the events that trigger transitions between those states.
Core Components of a State Diagram
- States: Conditions or situations during the lifecycle of an object. These can be simple states or composite states.
- Transitions: Arrows indicating movement from one state to another.
- Events: Triggers that cause a transition (e.g., a user click, a timer expiry, a database signal).
- Entry/Exit Actions: Activities performed automatically when entering or leaving a state.
- Initial and Final States: Markers for the start and end points of the lifecycle.
When to Use a State Diagram
State diagrams are essential when the focus is on status and reactions:
- Modeling the lifecycle of an order (e.g., Pending, Paid, Shipped, Delivered).
- Designing control systems for hardware or embedded devices.
- Implementing complex workflow engines where context matters more than sequence.
- Ensuring data integrity by restricting invalid transitions between states.
Limitations of State Diagrams
State diagrams are specialized tools with specific constraints:
- Scope: They focus on one object at a time. Modeling the interaction between many objects requires multiple diagrams.
- Flow Logic: They do not show the detailed steps taken to perform an action within a state as well as activity diagrams do.
- Complexity: As the number of states grows, the diagram can become a web of lines that is difficult to maintain.
Comparative Analysis 📊
To facilitate decision-making, the following table summarizes the key differences between the three models.
| Feature | Sequence Diagram | Activity Diagram | State Diagram |
|---|---|---|---|
| Primary Focus | Interaction & Time | Workflow & Logic | States & Events |
| Best For | API calls, Object interactions | Business processes, Algorithms | Object lifecycle, Status tracking |
| Concurrency | Limited (via combined fragments) | Strong (via fork/join) | Weak (unless nested states) |
| Object Context | Multiple objects | Abstract process | Single object focus |
| Granularity | High (Method level) | Medium (Activity level) | Low (State level) |
Decision Framework 🎯
Choosing the right diagram often comes down to the specific question you are trying to answer. Use the following decision matrix to guide your selection.
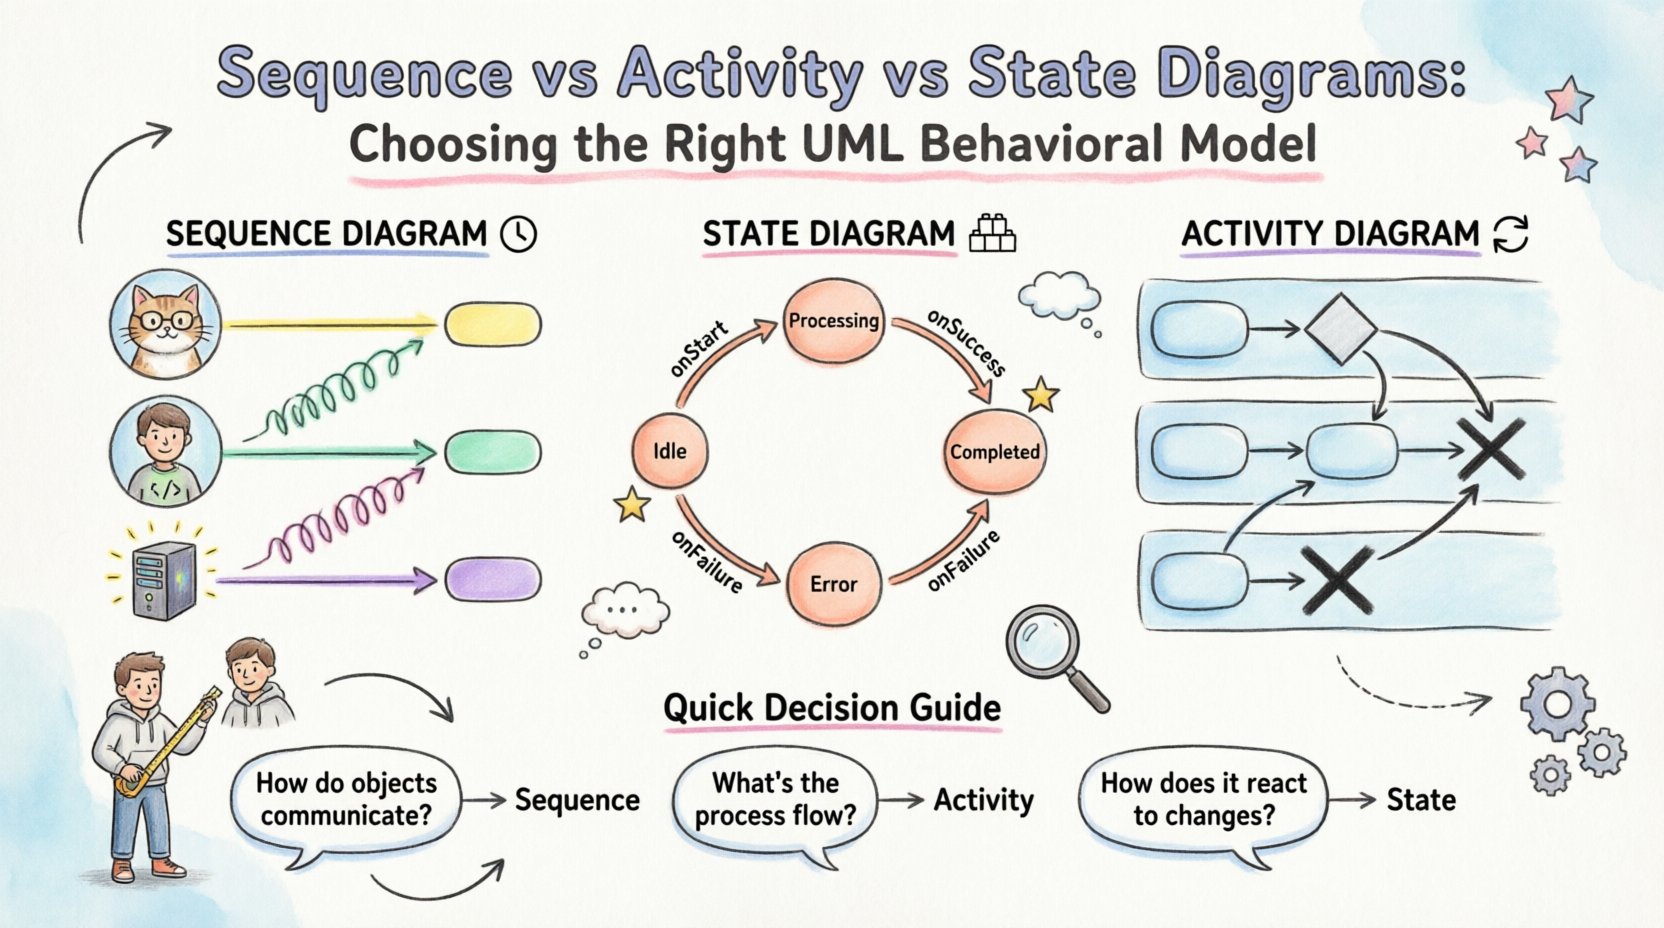
Question: How do objects communicate?
If the primary concern is the order of messages and the timing of calls between components, choose a Sequence Diagram. This is standard for software engineering tasks involving interfaces.
Question: What is the process flow?
If the concern is how a task moves from start to finish, including branches and parallel steps, choose an Activity Diagram. This is ideal for business analysts and process owners.
Question: How does the system react to changes?
If the concern is ensuring an object is in a valid condition before an action occurs, or how it moves from one status to another, choose a State Diagram. This is vital for reliability and data consistency.
Integration Strategies 🤝
In professional practice, these diagrams are rarely used in isolation. They form a cohesive documentation suite that provides a complete picture of the system.
- Sequence + State: Use a Sequence Diagram to show the flow of messages, but annotate the participants with their current State Diagram. This ensures that a message is only sent if the object is in a valid state.
- Activity + Sequence: Use an Activity Diagram for the high-level business process. When a specific step requires detailed technical implementation, expand it into a Sequence Diagram.
- Activity + State: Use an Activity Diagram to outline the workflow of a state machine. For example, the “Process Payment” activity might contain a sub-process defined by a State Diagram showing the payment gateway states.
Common Pitfalls 🚫
Even experienced architects make mistakes when modeling. Avoid these common errors to maintain the quality of your documentation.
- Over-Modeling: Creating diagrams for every minor function leads to maintenance nightmares. Focus on the critical paths and complex logic.
- Inconsistency: Ensure that the terminology used in the diagrams matches the codebase. If the code calls a method “saveRecord,” do not label it “SubmitData” in the diagram.
- Ignoring Constraints: State diagrams must explicitly define what happens if an invalid event occurs. Don’t assume the system will handle errors gracefully without modeling it.
- Lack of Context: A Sequence Diagram without a clear scope (e.g., “User Login”) is confusing. Always define the scenario being modeled.
Maintenance & Evolution 📈
Software is dynamic. Requirements change, and code evolves. Diagrams must evolve with them.
- Version Control: Treat diagrams as code. Store them in version control systems to track changes over time.
- Automated Generation: Where possible, generate diagrams from code or models to ensure they reflect the current system state. Manual updates often lag behind implementation.
- Review Cycles: Include diagram reviews in the design phase of every sprint. Ensure that new features are adequately represented in the behavioral models.
- Simplification: Regularly audit your diagrams. If a diagram has become too complex to understand, refactor it into smaller, more focused views.
Conclusion on Model Selection
Selecting between Sequence, Activity, and State diagrams is not about finding the perfect tool, but the right tool for the specific problem at hand. Sequence diagrams clarify interactions. Activity diagrams clarify processes. State diagrams clarify conditions.
By applying these models with precision, teams can reduce ambiguity, improve communication, and build systems that are robust and maintainable. The goal is clarity, not complexity. Use the behavioral model that makes the system logic most transparent to your audience.

