
Strategic planning relies heavily on accurate environmental scanning. The PEST analysis is a foundational framework used to identify Political, Economic, Social, and Technological factors influencing an organization. However, a common pitfall plagues many teams: the output is often broad, generic, and ultimately useless for decision-making.
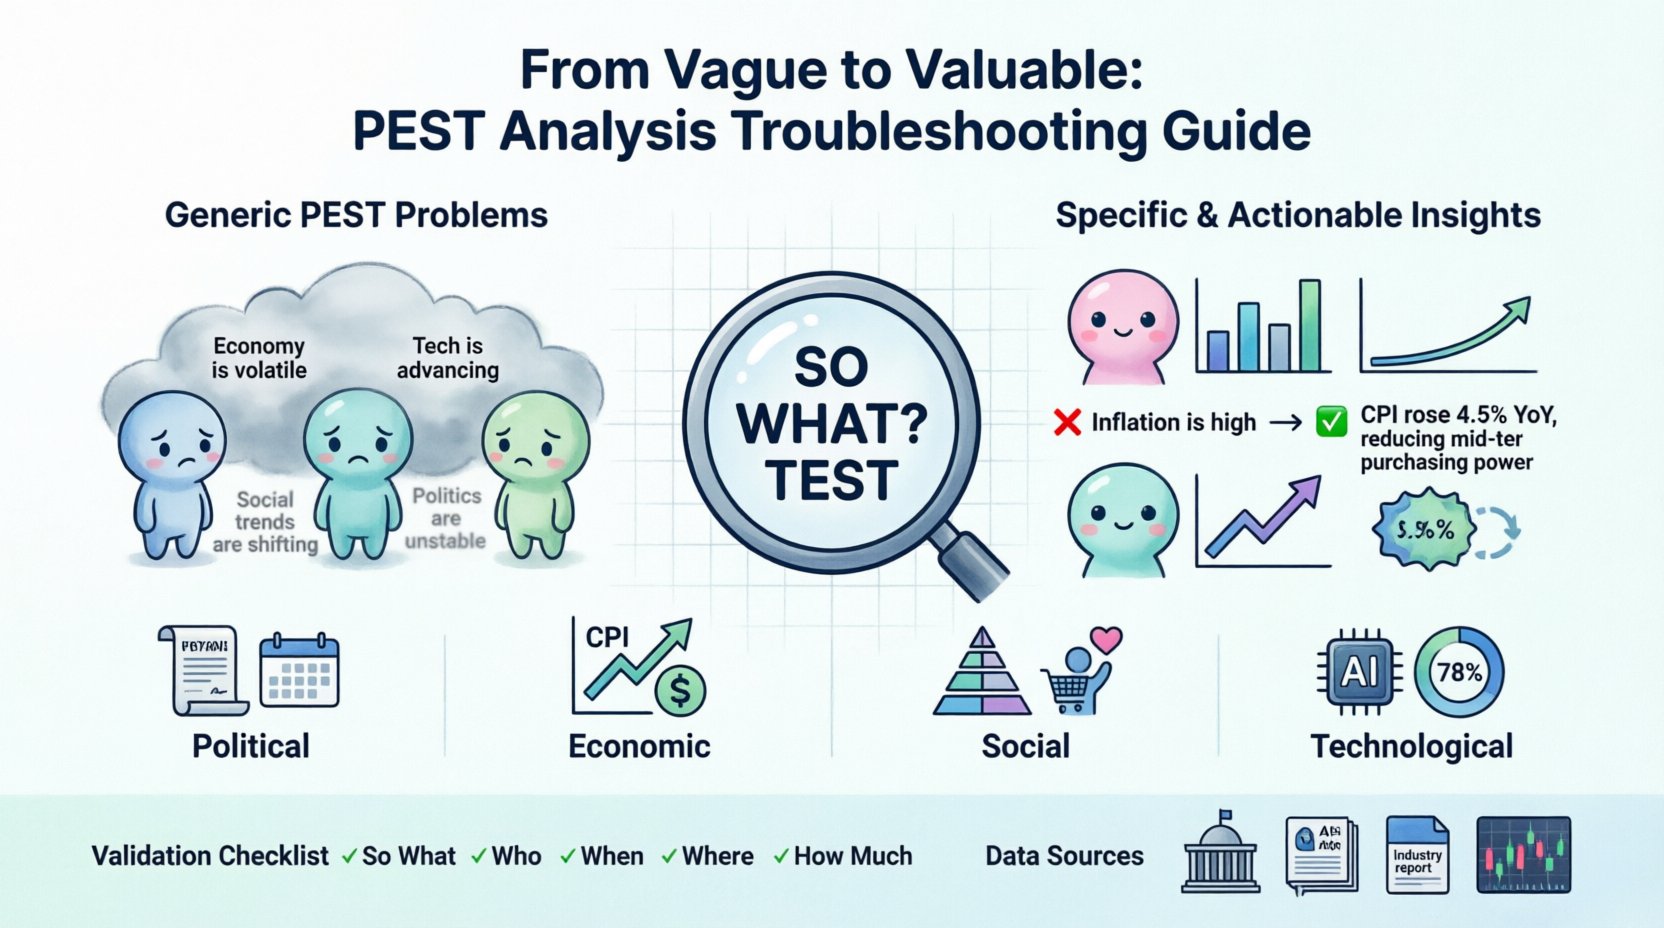
When a report states that “The economy is volatile” or “Technology is advancing”, it provides no actionable insight. This guide addresses the specific mechanics of refining a PEST analysis. We will move from general observations to data-driven intelligence. By applying rigorous scrutiny, you transform a standard checklist into a strategic asset.
🚩 Symptoms of a Generic PEST Analysis
Before fixing the problem, you must recognize it. A vague analysis typically exhibits specific characteristics. If your draft contains the following elements, it requires immediate revision.
- Lack of Specificity: Statements rely on generalities without naming regions, timeframes, or specific regulations.
- Absence of Data: Claims are not backed by statistics, reports, or historical trends.
- Irrelevance to Core Business: Factors mentioned do not directly impact your specific value proposition or operational model.
- Passive Voice: The analysis describes the environment rather than describing the impact on the business.
- Static Nature: It treats factors as fixed states rather than evolving trends.
A robust analysis answers the question: “So what?”. If the answer is not clear, the factor is too vague.
🔍 Root Causes of Vagueness
Understanding why an analysis becomes generic helps prevent recurrence. Common drivers include:
- Reliance on News Headlines: Mainstream media often simplifies complex macroeconomic or geopolitical events into soundbites that lack nuance.
- Groupthink: Teams often default to safe, universally known facts to avoid conflict or looking uninformed.
- Lack of Defined Scope: Failing to specify the geographic region or industry vertical leads to broad generalizations.
- Insufficient Research Time: Gathering specific data takes time. Teams often rush to fill the template.
- Disconnected from Strategy: If the analysis is done as a standalone exercise rather than linked to strategic goals, specificity becomes secondary.
🛠 Step-by-Step Troubleshooting Guide
To elevate the quality of your output, apply a systematic filter to every point you write. Follow this protocol for each of the four categories.
1. Refine the Political Factor (P)
Many teams write “Government regulations are changing.” This is insufficient. You must drill down into the mechanics of governance.
- Identify Specific Legislation: Name the acts, bills, or directives. Instead of “tax laws,” use “recent amendments to the corporate tax code in Region X.”
- Check for upcoming election cycles and their impact on policy stability.
- Review trade tariffs and their specific effect on supply chain costs.
- Analyze Regulatory Bodies: Which agency enforces the rule? How strict is their compliance history?
- Assess Political Stability: Is there a risk of civil unrest, policy shifts after elections, or bureaucratic red tape?
- Consider Geopolitics: How do international relations affect local operations? Look for sanctions or trade embargoes.
2. Refine the Economic Factor (E)
Economic factors are often reduced to “inflation” or “recession.” Precision here requires understanding the mechanics of capital and consumption.
- Specify Metrics: Use CPI (Consumer Price Index), GDP growth rates, or interest rate trends specific to your market.
- Disposable Income: How much money do your target customers actually have available for your product?
- Exchange Rates: If you import or export, currency fluctuation is a critical variable, not a generic trend.
- Employment Rates: Labor costs are driven by unemployment levels in your specific hiring sector.
- Business Cycle Position: Are you in a boom, recession, or recovery phase? How does this affect credit availability?
3. Refine the Social Factor (S)
Social trends are often misinterpreted as “lifestyle changes.” You need to look at demographics and cultural shifts.
- Demographic Shifts: Look at age distribution, migration patterns, and household size.
- Consumer Behavior: Are customers shifting toward sustainability? Are they valuing convenience over price?
- Health and Wellness: How does public health awareness impact demand for your product?
- Educational Levels: Does the workforce have the skills to support your operations?
- Cultural Attitudes: How do local customs influence your marketing or product acceptance?
4. Refine the Technological Factor (T)
Technology is the most frequently misused category. Avoid generic statements about “innovation.”
- Adoption Rates: How fast is the relevant technology being adopted by your customers?
- Obsolescence: Is your current infrastructure at risk of becoming outdated?
- R&D Investment: How much are competitors investing in research? What new patents are being filed?
- Automation Potential: Which specific processes can be automated to reduce costs?
- Security Risks: What are the specific cybersecurity threats facing your data infrastructure?
📊 Comparison: Generic vs. Specific
The table below illustrates the difference between a standard observation and an actionable insight. Use this as a template for your own editing.
| Factor | ❌ Generic Statement | ✅ Specific & Actionable Statement |
|---|---|---|
| Political | Regulations are getting stricter. | New environmental compliance laws (2024) require 20% reduction in carbon emissions by Q3, impacting manufacturing costs by 5%. |
| Economic | Inflation is high. | Consumer Price Index in the Northeast region has risen 4.5% year-over-year, reducing purchasing power for mid-tier products. |
| Social | People are working remotely. | 60% of our target demographic now prefers remote collaboration tools, increasing demand for cloud-based project management software. |
| Technological | AI is growing fast. | Generative AI tools are reducing content production time by 40%, threatening the margin of our current outsourced content model. |
📂 Data Sources for Accuracy
To avoid vagueness, you must cite credible sources. Relying on intuition is a recipe for failure. Use the following types of resources to ground your analysis.
- Government Publications: Census data, economic reports, and legislative records provide official baseline data.
- Industry Associations: Trade groups often publish white papers and market outlooks specific to your sector.
- Academic Journals: Research papers offer peer-reviewed insights into long-term trends.
- Financial Reports: Publicly traded competitors’ annual reports reveal their strategic focus and economic assumptions.
- Market Research Firms: Third-party data providers offer demographic breakdowns and consumer sentiment analysis.
Note: Always verify the date of the data. An economic report from three years ago may no longer reflect the current reality.
🧩 Validating Your Findings
Once you have drafted your specific points, run them through a validation checklist. This step ensures the analysis holds up to scrutiny.
- The “So What” Test: Does this factor change a business decision? If not, remove it.
- The “Who” Test: Does this affect a specific department or the whole organization?
- The “When” Test: Is this a short-term fluctuation or a long-term trend?
- The “Where” Test: Is this factor relevant to your specific geographic market?
- The “How Much” Test: Can you quantify the impact (e.g., cost increase, market share loss)?
🔄 Integrating Analysis into Strategy
A specific PEST analysis is only valuable if it informs strategy. Vague data leads to vague goals. Specific data leads to specific actions.
1. Connect to SWOT Analysis
Map your PEST findings directly to Strengths, Weaknesses, Opportunities, and Threats. For example, a specific political regulation (Threat) might require a new compliance protocol (Weakness). A specific social trend (Opportunity) might open a new product line (Strength).
2. Risk Assessment
Assign probability and impact scores to your specific factors. If inflation is rising by 4.5%, does that pose a high risk to margins? Quantifying the risk allows for better resource allocation.
3. Scenario Planning
Use your specific data to build scenarios. What happens if interest rates rise another 1%? What happens if a specific technology becomes obsolete? Specific variables allow for accurate simulation.
⚠️ Common Pitfalls to Avoid
Even with a good process, mistakes happen. Be vigilant against these common errors.
- Confirmation Bias: Only looking for data that supports your preconceived strategy.
- Overloading: Including too many factors dilutes focus. Stick to the top 3-5 critical drivers per category.
- Ignoring Interconnectivity: Political decisions often drive economic outcomes. Don’t analyze them in isolation.
- Static Snapshots: Treat the analysis as a living document. Revisit it quarterly.
- Ignoring Local Nuance: Global trends do not always apply locally. Always ground findings in local context.
🧪 Practical Example: Retail Expansion
Imagine a retail company planning to expand into a new region. A vague analysis might say, “The region has a growing middle class.” This is not enough.
A specific analysis would look like this:
- Political: Local zoning laws restrict store size to 5,000 sq ft, limiting inventory capacity.
- Economic: Average household income in the target zip code is $75,000, with a disposable income growth rate of 3%.
- Social: 70% of residents commute via public transport, suggesting a need for online ordering with pickup options.
- Technological: Mobile payment adoption is at 85%, requiring POS systems that support NFC technology.
This level of detail allows the company to make concrete decisions about store design, inventory, and checkout systems. The difference between the two approaches is the difference between a guess and a plan.
📉 Measuring Success Post-Analysis
How do you know your troubleshooting was successful? Look at the decision-making process. If the team can point to a specific factor and trace the decision back to it, the analysis was effective. If the decisions feel arbitrary, revisit the data.
- Decision Speed: Specific data often accelerates decision-making by removing ambiguity.
- Resource Efficiency: You allocate budget to the areas identified as high-impact.
- Risk Mitigation: You anticipate problems before they occur.
- Alignment: Teams remain aligned because they share the same factual basis.
🚀 Moving Forward with Confidence
Refining a PEST analysis requires discipline. It demands that you dig deeper than the headlines. It requires you to question assumptions and demand evidence. When you commit to specificity, you stop guessing and start knowing.
The goal is not to create a perfect document, but to create a useful one. A useful document drives action. It highlights the risks you can manage and the opportunities you can capture. By following the troubleshooting steps outlined here, you ensure that your strategic foundation is built on solid ground, not shifting sand.
Start your next review by challenging every general statement. Ask for the number. Ask for the date. Ask for the source. This simple habit will significantly improve the quality of your strategic planning.

