


The Unified Modeling Language (UML) serves as the standard blueprint for software systems. It provides a visual language to describe, specify, construct, and document the artifacts of a software system. Selecting the correct diagram type is critical for effective communication among stakeholders. Without a clear model, teams risk misalignment, technical debt, and scope creep.
This guide explores the various diagram types available within the standard. We will examine their specific use cases, the elements they contain, and how they fit into the software development lifecycle. By the end, you will have a clear understanding of which tool fits your specific architectural needs.
Understanding the Two Main Categories 🏗️
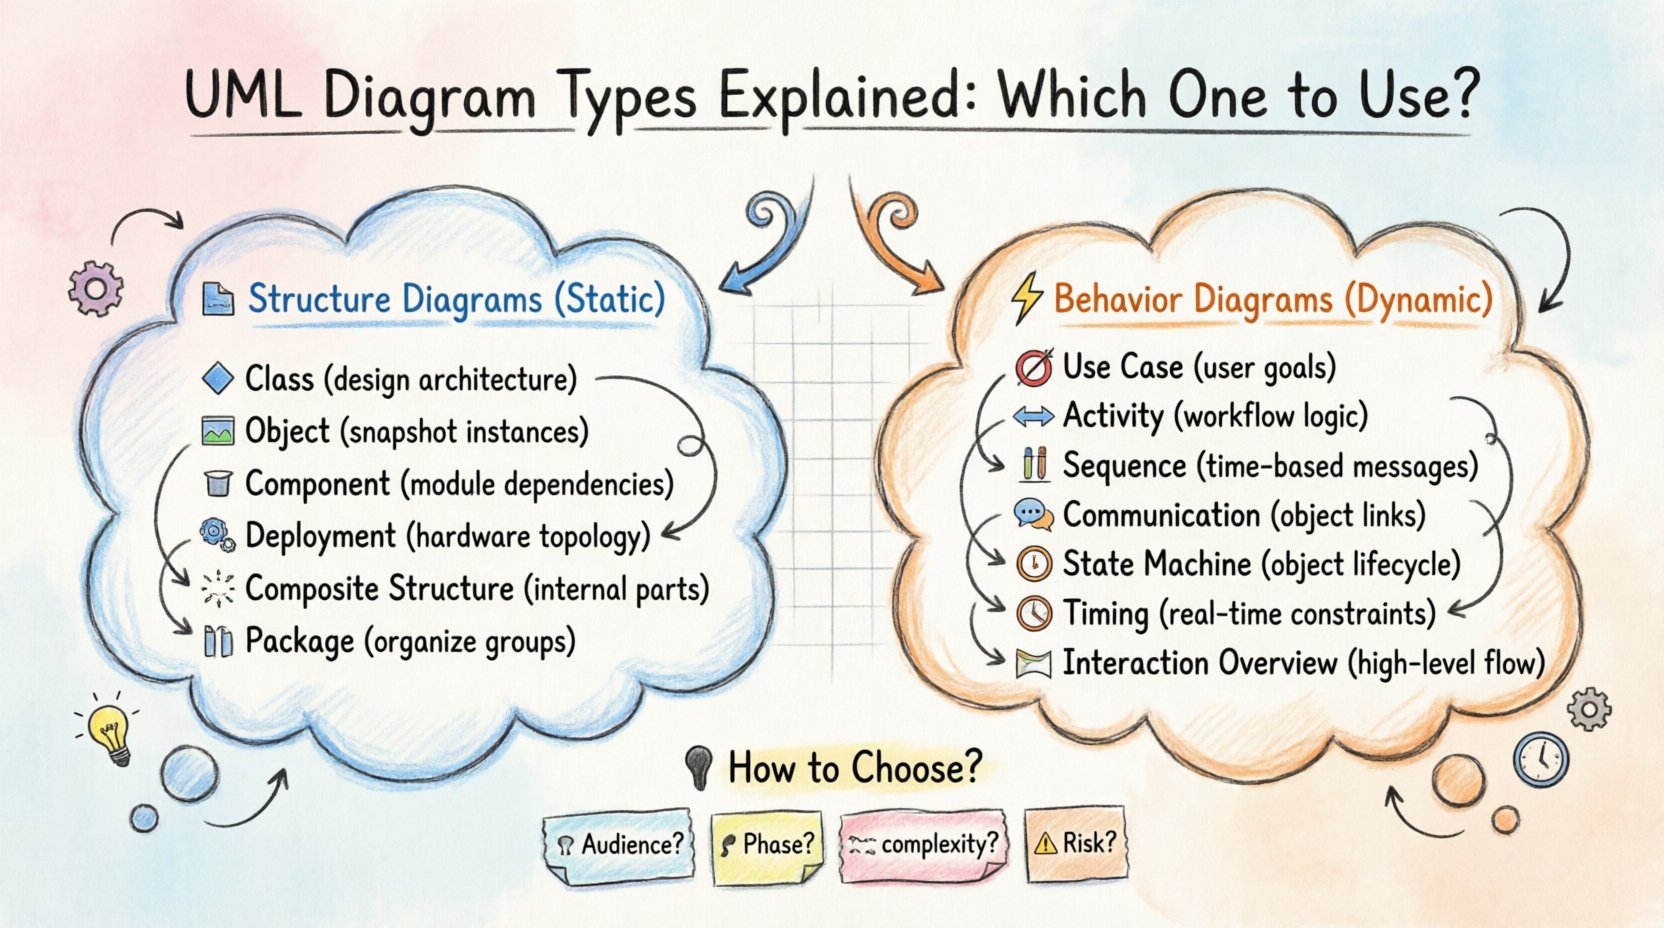
UML diagrams are broadly divided into two categories: Structure Diagrams and Behavior Diagrams. This distinction is fundamental to how you approach modeling.
- Structure Diagrams: These show the static aspects of a system. They depict the physical and logical structure, including classes, objects, components, and relationships. Think of these as the architectural drawings of a building.
- Behavior Diagrams: These show the dynamic aspects of a system. They depict the functionality, interactions, and state changes over time. These are similar to a script or a flow of action within that building.
Understanding this split helps prevent confusion. You do not need every diagram for every project. Selecting the right mix depends on the phase of development and the complexity of the system.
Structure Diagrams: The Static Blueprint 🧱
Structure diagrams describe the things that exist in the system at a specific point in time. They are the foundation upon which the dynamic behavior rests.
1. Class Diagram 🔷
The class diagram is the most common type of UML diagram. It describes the structure of a system by showing the system’s classes, their attributes, operations, and the relationships among objects.
- Key Elements: Classes (rectangles), Attributes (properties), Methods (operations), Associations (lines), Inheritance (arrows with hollow triangles), and Aggregation/Composition (diamonds).
- When to Use: Use this during the design phase to define the object-oriented architecture. It is essential for database schema design and API contract definition.
- Benefit: Provides a clear map of data relationships and dependencies.
2. Object Diagram 🖼️
An object diagram describes a specific snapshot of data in the system at a specific point in time. It is essentially an instance of a class diagram.
- Key Elements: Objects (rectangles with underlined names), Links (connections between objects).
- When to Use: Use this to verify the validity of a class diagram or to debug specific scenarios. It helps visualize how instances interact in a concrete situation.
- Benefit: Offers a concrete view of abstract class structures.
3. Component Diagram 📦
A component diagram depicts the organization and dependencies between software components. It represents the implementation view of a system.
- Key Elements: Components (rectangles with the component icon), Interfaces (provided and required), Dependencies (dashed lines).
- When to Use: Use this when working with large-scale systems involving multiple modules or third-party libraries.
- Benefit: Helps manage complexity by grouping related functionality into manageable units.
4. Deployment Diagram 🌐
This diagram shows the hardware used in the system, including servers, networks, and devices. It captures the physical topology of the system.
- Key Elements: Nodes (hardware devices), Artifacts (software files), Communication Paths (lines).
- When to Use: Use this during the infrastructure planning phase. It is crucial for DevOps teams and system architects.
- Benefit: Clarifies the runtime environment and hardware requirements.
5. Composite Structure Diagram 🧩
This diagram shows the internal structure of a class or component and how it interacts with its environment. It breaks down a single class into its constituent parts.
- Key Elements: Parts, Connectors, Ports, Interfaces.
- When to Use: Use this when a class is complex and requires internal sub-components to function.
- Benefit: Allows for detailed design of complex internal logic without cluttering the main class diagram.
6. Package Diagram 📁
A package diagram organizes model elements into groups or packages. It acts as a namespace to manage complexity.
- Key Elements: Packages (folders), Dependencies between packages.
- When to Use: Use this in large projects to organize classes and components logically.
- Benefit: Improves readability and maintainability of large models.
Behavior Diagrams: The Dynamic Flow ⚡
Behavior diagrams describe the actions and interactions that occur within the system. They focus on how the system behaves rather than how it is built.
7. Use Case Diagram 🎯
A use case diagram captures the functional requirements of a system. It shows the interactions between actors (users or external systems) and the system itself.
- Key Elements: Actors (stick figures), Use Cases (ovals), Relationships (lines).
- When to Use: Use this during the requirements gathering phase. It is ideal for communicating with non-technical stakeholders.
- Benefit: Defines the scope of the system and user goals clearly.
8. Activity Diagram 🔄
An activity diagram describes the flow of control in a system. It is similar to a flowchart and can represent business processes or algorithmic logic.
- Key Elements: Actions (rounded rectangles), Control Flow (arrows), Forks/Joins (bars), Swimlanes (divisions).
- When to Use: Use this to model complex workflows or business logic that spans multiple actors or components.
- Benefit: Visualizes parallel processes and decision points effectively.
9. Sequence Diagram 📊
A sequence diagram shows how objects interact with each other in the order of time. It is an interaction diagram that emphasizes the sequence of messages.
- Key Elements: Lifelines (vertical dashed lines), Messages (arrows), Activation Bars.
- When to Use: Use this to design API interactions or detailed logic flows between objects.
- Benefit: Makes the timing and order of interactions explicit.
10. Communication Diagram 🗣️
Similar to a sequence diagram, a communication diagram shows interactions between objects. However, it focuses on the structural organization of the objects rather than the time sequence.
- Key Elements: Objects, Links, Messages with sequence numbers.
- When to Use: Use this when the structural relationship between objects is more important than the timing of messages.
- Benefit: Provides a clearer view of object relationships.
11. State Machine Diagram 🔄
A state machine diagram describes the lifecycle of an object. It shows the states an object goes through in response to events.
- Key Elements: States (circles or rounded boxes), Transitions (arrows), Events, Guards.
- When to Use: Use this for objects with complex lifecycle management, such as orders, tickets, or authentication sessions.
- Benefit: Prevents invalid states and clarifies state transitions.
12. Timing Diagram ⏱️
A timing diagram focuses on the time constraints of interactions. It is specialized for systems where timing is critical.
- Key Elements: Lifelines, Time scale, State changes.
- When to Use: Use this for real-time systems or embedded systems where delays matter.
- Benefit: Analyzes performance and timing constraints explicitly.
13. Interaction Overview Diagram 🗺️
This diagram combines elements of activity diagrams and interaction diagrams. It shows the flow of control from one interaction to another.
- Key Elements: Nodes from activity diagrams, Frames for interactions.
- When to Use: Use this to organize complex interactions into a high-level workflow.
- Benefit: Bridges the gap between high-level processes and detailed interactions.
Comparison and Selection Guide 📋
Selecting the right diagram requires understanding the goal of the model. The table below summarizes the primary use cases for each type.
| Diagram Type | Category | Primary Focus | Best Used For |
|---|---|---|---|
| Class Diagram | Structure | Static Structure | Database design, API contracts |
| Sequence Diagram | Behavior | Time-based Interaction | API flow, logic debugging |
| Use Case Diagram | Behavior | Functional Requirements | Stakeholder meetings, scope definition |
| Deployment Diagram | Structure | Hardware/Infrastructure | DevOps, system architecture |
| State Machine Diagram | Behavior | Object Lifecycle | Complex workflow states |
How to Choose the Right Diagram 🤔
Deciding which diagrams to create depends on several factors. You should not create every type for every project. Consider the following questions:
- What is the audience? If stakeholders are non-technical, start with Use Case Diagrams. If developers are the audience, Class and Sequence Diagrams are more appropriate.
- What is the development phase? Early phases require Use Case and Activity diagrams. Design phases require Class and Component diagrams. Deployment phases require Deployment diagrams.
- What is the system complexity? Simple systems may only need a Class Diagram and a few Sequence Diagrams. Complex distributed systems require Package and Deployment diagrams.
- What is the critical risk? If timing is critical, use Timing Diagrams. If data integrity is critical, use State Machine Diagrams.
Best Practices for Modeling ✅
To ensure your diagrams remain useful over time, follow these guidelines.
- Keep it Simple: A diagram that is too complex is useless. Break large diagrams into smaller packages or sub-diagrams.
- Maintain Consistency: Use consistent naming conventions across all diagrams. A class name in a Class Diagram should match the object name in a Sequence Diagram.
- Version Control: Treat your diagrams as code. Store them in version control systems to track changes over time.
- Document Assumptions: Add notes to diagrams to explain specific design decisions or constraints.
- Review Regularly: Models become outdated as requirements change. Schedule reviews to ensure the diagrams match the current system.
Common Pitfalls to Avoid ❌
Even experienced architects make mistakes when modeling. Watch out for these common issues.
- Over-Modeling: Creating detailed diagrams for simple features wastes time. Focus on high-risk or high-complexity areas.
- Ignoring Constraints: Failing to document performance or security constraints in the diagrams can lead to implementation surprises.
- Inconsistent Notation: Mixing standard UML symbols with custom symbols confuses readers. Stick to the standard notation.
- Static Documentation: Treating diagrams as a one-time deliverable rather than a living document leads to technical debt.
Final Thoughts 🚀
UML provides a powerful toolkit for visualizing software systems. By understanding the distinct purposes of Structure and Behavior diagrams, you can select the right tools for your specific project needs. Remember that the goal of modeling is communication, not just documentation. Choose the diagrams that facilitate the best understanding for your team and stakeholders.
Start with the basics, such as Class and Use Case diagrams, and expand your modeling strategy as the project grows in complexity. With practice, you will develop an intuition for which view is needed at each stage of the development lifecycle.

